Select Page

News

.

We are thrilled to share some exciting updates on our recent publications!

The paper led by my student M. Naser Lessani, “SGWR: similarity and geographically weighted regression”, became the #1 most read articles published last year in the International Journal of Geographical Information Science (IJGIS). Read it here: https://lnkd.in/eUHrkPND

The paper led by professor Siqin (Sisi) Wang from USC, “GPT, large language models (LLMs) and generative artificial intelligence (GAI) models in geospatial science: a systematic review”, became the #1 most read articles published last year in the International Journal of Digital Earth (IJDE). Read it here: https://lnkd.in/e8pk9xeA

Our autonomous GIS definition paper, co-authored with my student Huan Ning, titled “Autonomous GIS: the next-generation AI-powered GIS”, has became the #1 most read and top 5 most cited articles of the past three years, and is among the top 10 most read articles of all time in IJDE! Read it here: https://lnkd.in/eibR34pb

We invite you to explore those works, and hope you find them interesting and inspiring!

The Future of Geographic Information Systems: Embracing Autonomous GIS for Land Use Prediction

Check out this article about Autonomous GIS: The Future of Geographic Information Systems: Embracing Autonomous GIS for Land Use Prediction

In the rapidly evolving landscape of Geographic Information Systems (GIS), the integration of artificial intelligence (AI) marks a significant turning point. Autonomous GIS represents a new era of GIS, driven by advanced AI capabilities that facilitate automated spatial data collection, analysis, and visualization. This innovative approach aims to tackle complex spatial problems more efficiently and effectively than traditional methods.

At its core, autonomous GIS leverages large language models (LLMs) to enhance natural language understanding, reasoning, and coding. This empowers the system to achieve five autonomous goals: self-generation, self-organization, self-validation, self-execution, and self-growth. By achieving these objectives, autonomous GIS promises to revolutionize the way we interact with spatial data, making it more intuitive and responsive to user needs.

….

Charting the Future of AI-driven GIS: A Vision and Research Agenda for Autonomous GIS

We are thrilled to announce our latest vision paper (preprint), GIScience in the Era of Artificial Intelligence: A Research Agenda Towards Autonomous GIS,” led by Dr. Zhenlong Li and Ph.D. candidate Huan Ning from the Geoinformation and Big Data Research Lab at Penn State. This paper, a collaborative effort involving GIScience experts across academia, national labs, and government agencies, presents a timely research agenda for the next evolutionary stage of GIS—one that is autonomous, intelligent, more accessible, and powered by AI.

This work is rooted in the lab’s ongoing innovative research on integrating AI into spatial analysis. Over the past two years, we have been developing foundational ideas and prototype systems that explore how large language models (LLMs) can serve as decision-making cores and build geoprocessing workflows in GIS applications. This vision paper builds on our earlier work, particularly the 2023 paper that formally introduced and defined the concept of Autonomous GIS (Li & Ning, 2023), by expanding the conceptual framework, demonstrates early-stage implementations, and outlines a roadmap for advancing this emerging paradigm….. Read the full post here.

You can access the preprint here and the original Autonomous GIS definition paper here.

GIBD makes strong impact at the 2025 AAG Annual Meeting in Detroit

The Geoinformation and Big Data Research Lab (GIBD) at Penn State had a great presence at the 2025 Annual Meeting of the American Association of Geographers (AAG), held in Detroit, Michigan, from March 24–28, 2025. Our lab organized and co-organized a total of 13 in-person sessions, centered around cutting-edge research in geospatial big data, spatial computing, autonomous GIS, human mobility, disaster management, and public health….

Read the full post here.

Join us for a series of insightful sessions at AAG 2025

If you are attending AAG this year, we cordially invite you to join our 13 in-person sessions focused on geospatial big data, spatial computing, autonomous GIS, human mobility, disaster management, and public health!

Date: 3/25/2025
Time: 12:50 PM – 2:10 PM
Room: 251A, Level 2, Huntington Place
Type: Panel
Date: 3/25/2025
Time: 8:30 AM – 9:50 AM
Room: 251A, Level 2, Huntington Place
Date: 3/24/2025
Time: 8:30 AM – 9:50 AM
Room: 356, Level 3, Huntington Place
Date: 3/28/2025
Time: 12:50 PM – 2:10 PM
Room: 356, Level 3, Huntington Place
Date: 3/24/2025
Time: 10:10 AM – 11:30 AM
Room: 356, Level 3, Huntington Place
Date: 3/24/2025
Time: 2:30 PM – 3:50 PM
Room: 356, Level 3, Huntington Place
Date: 3/27/2025
Time: 8:30 AM – 9:50 AM
Room: 356, Level 3, Huntington Place
Date: 3/27/2025
Time: 10:10 AM – 11:30 AM
Room: 356, Level 3, Huntington Place
Date: 3/28/2025
Time: 2:30 PM – 3:50 PM
Room: 332, Level 3, Huntington Place
Type: Paper
Date: 3/26/2025
Time: 4:10 PM – 5:30 PM
Room: 356, Level 3, Huntington Place
Type: Paper
Date: 3/26/2025
Time: 2:30 PM – 3:50 PM
Room: 250C, Level 2, Huntington Place
Type: Paper
Date: 3/26/2025
Time: 4:10 PM – 5:30 PM
Room: 250C, Level 2, Huntington Place
Type: Paper
Date: 3/26/2025
Time: 12:50 PM – 2:10 PM
Room: 250C, Level 2, Huntington Place
Type: Paper
M. Naser Lessani elected as Student Director for the Cyberinfrastructure Specialty Group, AAG
M. Naser Lessani, a Ph.D. student from our team, has been elected as the Student Director for the Cyberinfrastructure Specialty Group (CISG) of the AAG for the 2025-2026 term.  He is currently pursuing his Ph.D. in the Department of Geography at The Pennsylvania State University, focusing on geospatial data analytics, geospatial modeling, machine learning, computational analysis, and the role of human mobility in the spread of infectious diseases. Additionally, Naser serves as a graduate student representative within the department, alongside five other students.
The Cyberinfrastructure Specialty Group (CISG) of the AAG promotes the integration of cyberinfrastructure into geographic research and education https://www.aag.org/about-us/. It fosters collaboration among geographers and GIScientists to address complex geographic challenges. The group also develops training programs to equip professionals with skills in cyberinfrastructure tools. Additionally, it advocates for policies supporting data management, sharing, and technological advancements in geography.
Congratulations, Naser!
GIBD members attended the 6th Nation Big Data health Science Conference

GIBD lab members recently participated in the 6th National Big Data Health Science Conference, held on February 13-14, 2025, at the Pastides Alumni Center, University of South Carolina, Columbia. The conference, themed “Unlocking the Power of Big Data in Health: Transforming Data into Actionable Intelligence,” brought together experts to discuss advancements in health data science.

GIBD Lab members contributed significantly to the event:

  • Huan Ning delivered an oral presentation on “A Mapping Toolkit for Built Environment Auditing Based on Street View Imagery”
  • Naser Lessani presented a poster titled “Leveraging Large Language Models for Systematic Reviewing: A Case Study Using HIV Medication Adherence Research”.

  • Temitope Akinboyewa presented a poster titled “Smartphone-Based Place Visitation Data Better Explain Neighborhood-Level Coronary Heart Disease in the United States”.

Additionally, the lab hosted an exhibition table, demonstrating our recent research activities to attendees.

Our IJGIS article “SGWR: similarity and geographically weighted regression” becomes the most read article in IJGIS

The article titled “SGWR: similarity and geographically weighted regression”, authored by Naser Lessani and Zhenlong Li, becomes the most read articles published in the International Journal of Geographical Information Science in the last year!


Zhenlong Li gave an invited talk at the 14th ISDE International Lectures themed on Unleashing the Potential of Generative AI in GIScience

The 14th ISDE International Lectures, themed “Harnessing the Power of Generative AI in GIScience”, successfully took place on 21 January 2025, attracting over 3,400 participants worldwide via platforms such as Zoom and the ISDE Bilibili channel. This event brought together leading experts in the field of GIScience to explore the diverse applications of Generative AI in understanding human-environment interactions, disaster management, and the development of next-generation GIS systems. Dr. Zhenlong Li presented on “Autonomous GIS: The Next-Generation AI-Powered GIS.” He introduced the concept of the Autonomous GIS, which leverages advanced AI technologies to create intelligent and adaptive geospatial systems. Dr. Li showcased a prototype called LLM-Geo that uses large language models to automate spatial data collection, analysis, and visualisation. The system demonstrated its ability to retrieve human mobility data and visualise trends, highlighting the potential of Autonomous GIS to revolutionise spatial analysis and decision-making processes. In addition to presenting, Dr. Li also served as the event’s moderator, facilitating engaging discussions throughout the session.

May be an image of 4 people and text


Zhenlong Li is elected as a Fellow of American Association of Geographers (AAG Fellow)

Dr. Zhenlong Li has been elected as a Fellow of the American Association of Geographers (AAG), joining 17 other distinguished geographers in this prestigious recognition for the class of 2025!

The AAG Fellows is a recognition and service program that applauds geographers who have made significant contributions to advancing geography. AAG Fellows serve the AAG by contributing to AAG initiatives; advising on AAG strategic directions and grand challenges; serving on AAG task forces or committees; and/or by mentoring early and midcareer faculty. The honorary title of AAG Fellow is conferred for life. Once designated, AAG Fellows remain part of this ever-growing advisory body.

“AAG Fellows show exemplary accomplishments in a wide range of geography specialties,”said Dr. Gary Langham, Executive Director of the AAG. “They are the scholars, mentors, and advocates who consistently advance the geography discipline.”

AAG citation: 

Zhenlong Li“Dr. Zhenlong Li is an associate professor in the Department of Geography at Pennsylvania State University and leads the Geoinformation and Big Data Research Laboratory. He is a leading scholar in GIScience focusing on geospatial big data, spatial computing, and geospatial AI. His research aims to enhance knowledge discovery and decision-making regarding hazards, public health, population mobility, and climate change. His work is widely recognized with over 100 well-cited articles published in top-tier international journals, supported by extensive research grants from prestigious sponsors including NSF and NIH. Dr. Li emphasizes equipping future GIScientists with strong problem-solving abilities by integrating spatial and computational thinking in his teaching and advising, and a number of his mentees have secured prominent academic and professional positions. He currently serves as an associate editor of the International Journal of Digital Earth and International Journal of Applied Earth Observation and Geoinformation. Previously, he served as the Chair of the AAG Cyberinfrastructure Specialty Group and co-Chair of Earth Science Information Partnership (ESIP) Cloud Computing Group. Dr. Li’s significant contributions to the advancement of GIScience and his role as a rising leader in the discipline make him a valued member of the geography community and a deserving recipient of the AAG Fellow distinction.  The AAG is very proud to recognize Dr. Zhenlong Li as an AAG Fellow. “

https://www.aag.org/2024-aag-awards-recognition/

New Course Offering: GEOG 560 Seminar in GIScience – Geospatial Big Data and GeoAI: Innovations and Applications

As the volume of geospatial data explodes—from satellite imagery and sensor networks to crowdsourced social media feeds—new analytical approaches are transforming our ability to understand and respond to real-world challenges. Dive into the cutting edge of Geographic Information Science (GIScience), where geospatial big data and AI fuel discovery, innovation, and problem-solving across a range of fields.

What You’ll Explore

This seminar explores the latest innovations in GIScience, with a focus on the integration of geospatial big data, spatial computing, and geospatial artificial intelligence to address complex geospatial and computational problems. Key topics include geospatial big data and its applications; concepts of spatial computing; GeoAI and machine learning for spatial data; social sensing and volunteered geographic information; geospatial web services and interoperability, and National Spatial Data Infrastructure.

Why Enroll?

  • Engage with cutting-edge research and emerging technologies.
  • Build analytical and critical thinking skills in data-driven GIScience.
  • Expand your professional toolkit with knowledge in big data management, spatial AI, and geospatial web services.
  • Contribute to dynamic class discussions grounded in contemporary literature, case studies, and real-world scenarios.

Who Should Join?

This seminar is ideal for graduate students who have at least basic GIS training. Whether you’re aiming for a career in academia, industry, government, or non-profit, this course will help position you at the forefront of geospatial innovation.

New article: Optimizing county-level infectious respiratory disease forecasts: a pandemic case study integrating social media-based physical and social connectivity networks

Access the full article at: https://doi.org/10.1080/17538947.2024.2436486

Abstract: Forecasting infectious respiratory diseases is crucial for effective prevention and intervention strategies. However, existing time series forecasting models that incorporate human mobility data have faced challenges in making localized predictions on a large scale across the country due to data costs and constraints. Using the COVID-19 pandemic as a case study, this research explores whether integrating social media-based place and social connectivity networks can improve predictions of disease transmission at the county level across various regions. Place connectivity networks, derived from Twitter users and tweets, and social connectivity networks, based on Facebook interactions, were used to map spatial and social linkages between locations. These networks were integrated into weekly COVID-19 incidence data across 2,927 U.S. counties using Long Short-Term Memory (LSTM) models. The combined connectivity-weighted model significantly enhanced prediction accuracy, reducing Mean Absolute Percentage Error (MAPE) by 49.38% across 96.62% of the counties, with the greatest improvements observed in urban and Northeastern counties. The results demonstrate that combining connectivity networks enhances prediction accuracy, offering a scalable and sustainable solution for localized disease forecasting on a large scale across diverse geographic areas using publicly accessible social media data.


GIBD will be organizing a series of in-person sessions at the 2025 AAG Annual Meeting in Detroit!

We are pleased to announce that GIBD Lab will be hosting a series of very interesting in-person sessions at the 2025 AAG Annual Meeting in Detroit!  We warmly invite you to join us and present your work in one of our sessions if it aligns with your research. To participate, simply email your abstract code to one of the organizers listed in the session. Please include the name of the session you’d like to present in when submitting your abstract. Let’s come together to share insights and advance research in geospatial big data. We look forward to your contributions!

  1. Harnessing Geospatial Big Data for Infectious Diseases
  2. Geospatial Big Data for Analyzing and Understanding Human Mobility Patterns
  3. Social Sensing and Big Data Computing for Disaster Management
  4. Big Data Computing for Geospatial Applications
  5. Big Data Computing for Geospatial Applications (2)
  6. Harnessing the Power of Generative AI in GIScience through Autonomous GIS Agents
  7. Integrative Approaches to Understanding Human Mobility and Health Outcomes
  8. Urban Sensing and Understanding via Geospatial Big Data and AI (I)
  9. Urban Sensing and Understanding via Geospatial Big Data and AI (II)
  10. GIScience and Hazards (I)
  11. GIScience and Hazards (II)
  12. Uncertainties in Big Data Analytics in Disaster Research
  13. GeoAI and Deep Learning Symposium: Generative AI in GIScience: a research agenda towards Autonomous GIS (Panel Session)

Presentations

  1. GIS Copilot: Towards an Autonomous GIS Agent for Spatial Analysis
  2. An anti-Asian area racism index
  3. Understanding Urban Park Visitors’ Pattern in New York City and the Growing Inequity Issues: A longitudinal Study with SafeGraph Foot Traffic Data
  4. Enhancing computational efficiency of the similarity and geographically weighted (SGWR) regression model and introducing its Python implementation
  5. LLM-Find: An Autonomous GIS Agent Framework for Geospatial Data Retrieval and Downloading
  6. Autonomous GIS: the next-generation AI-powered GIS
  7. Comparative Analysis of Human Mobility Patterns: Utilizing Taxi and Mobile (SafeGraph) Data to Investigate Neighborhood-Scale Mobility in New York City 


GIBD Lab Members Present Innovative Research at Penn State GIS Day 2024

The Geoinformation and Big Data Research Lab (GIBD) at Penn State was well-represented at the Penn State GIS Day 2024, held on November 13. This year’s event, themed “Geographers Take Action,” highlighted the transformative role of geographic information systems (GIS) in addressing pressing global challenges. GIBD lab members made significant contributions, presenting their cutting-edge research to the Penn State community and beyond.

Dr. Zhenlong Li, Associate Professor in the Department of Geography and Director of the GIBD Lab, led the team in a dynamic series of presentations. PhD students Temitope Ezekiel Akinboyewa, Huan Ning, and Mohammad Naser Lessani each presented innovative projects that demonstrate the lab’s interdisciplinary focus and commitment to leveraging geospatial technologies for societal benefit.

  • Temitope Ezekiel Akinboyewa presented “GIS Copilot: Towards an Autonomous GIS Agent for Spatial Analysis.” His talk explored the development of an intelligent GIS assistant designed to automate spatial analyses.
  • Huan Ning delivered a presentation titled “Estimating Hourly Neighborhood Population Using Mobile Phone Data.” He discussed methodologies for utilizing mobile phone data to estimate population dynamics at the neighborhood level, providing insights into urban mobility patterns.
  • Mohammad Naser Lessani presented “Enhancing the Computational Efficiency of Similarity and Geographically Weighted Regression Model.” His research focused on improving the performance of spatial statistical models through parallel computing techniques.
  • Dr. Zhenlong Li rounded out the presentations by providing an overview of the lab’s latest projects, including its pioneering work in applying generative AI for geospatial analysis. He also emphasized the lab’s ongoing collaborations across disciplines, reinforcing the importance of geospatial data science in tackling real-world challenges.

The event was an excellent platform for lab members to engage with fellow researchers, students, and industry professionals, fostering meaningful discussions and future collaborations. As part of the GIBD Lab’s mission to advance geospatial knowledge and innovation, participation in events like GIS Day underscores the lab’s dedication to impactful research and outreach.

For more information about the GIBD Lab and its research initiatives, visit https://giscience.psu.edu/research-overview/.

For more information about Penn State GIS Day 2024, visit https://www.psu.edu/news/university-libraries/story/penn-state-gis-day-activities-focus-theme-geographers-take-action

Introducting GIS Copilot: Towards an Autonomous GIS Agent for Spatial Analysis

The Geoinformation and Big Data Research Lab have unveiled an innovative tool, GIS Copilot, which integrates Large Language Models (LLMs) into Geographic Information Systems (GIS) to enable users to perform spatial analysis using natural language. The GIS Copilot is a step closer to achieving the broader vision of Autonomous GIS, which aim at democratizing access to spatial analysis, making it accessible to users of all expertise levels.

GIS Copilot operates as a plugin for the QGIS platform, enabling users to perform spatial operations through simple natural language, spanning from basic operations such as

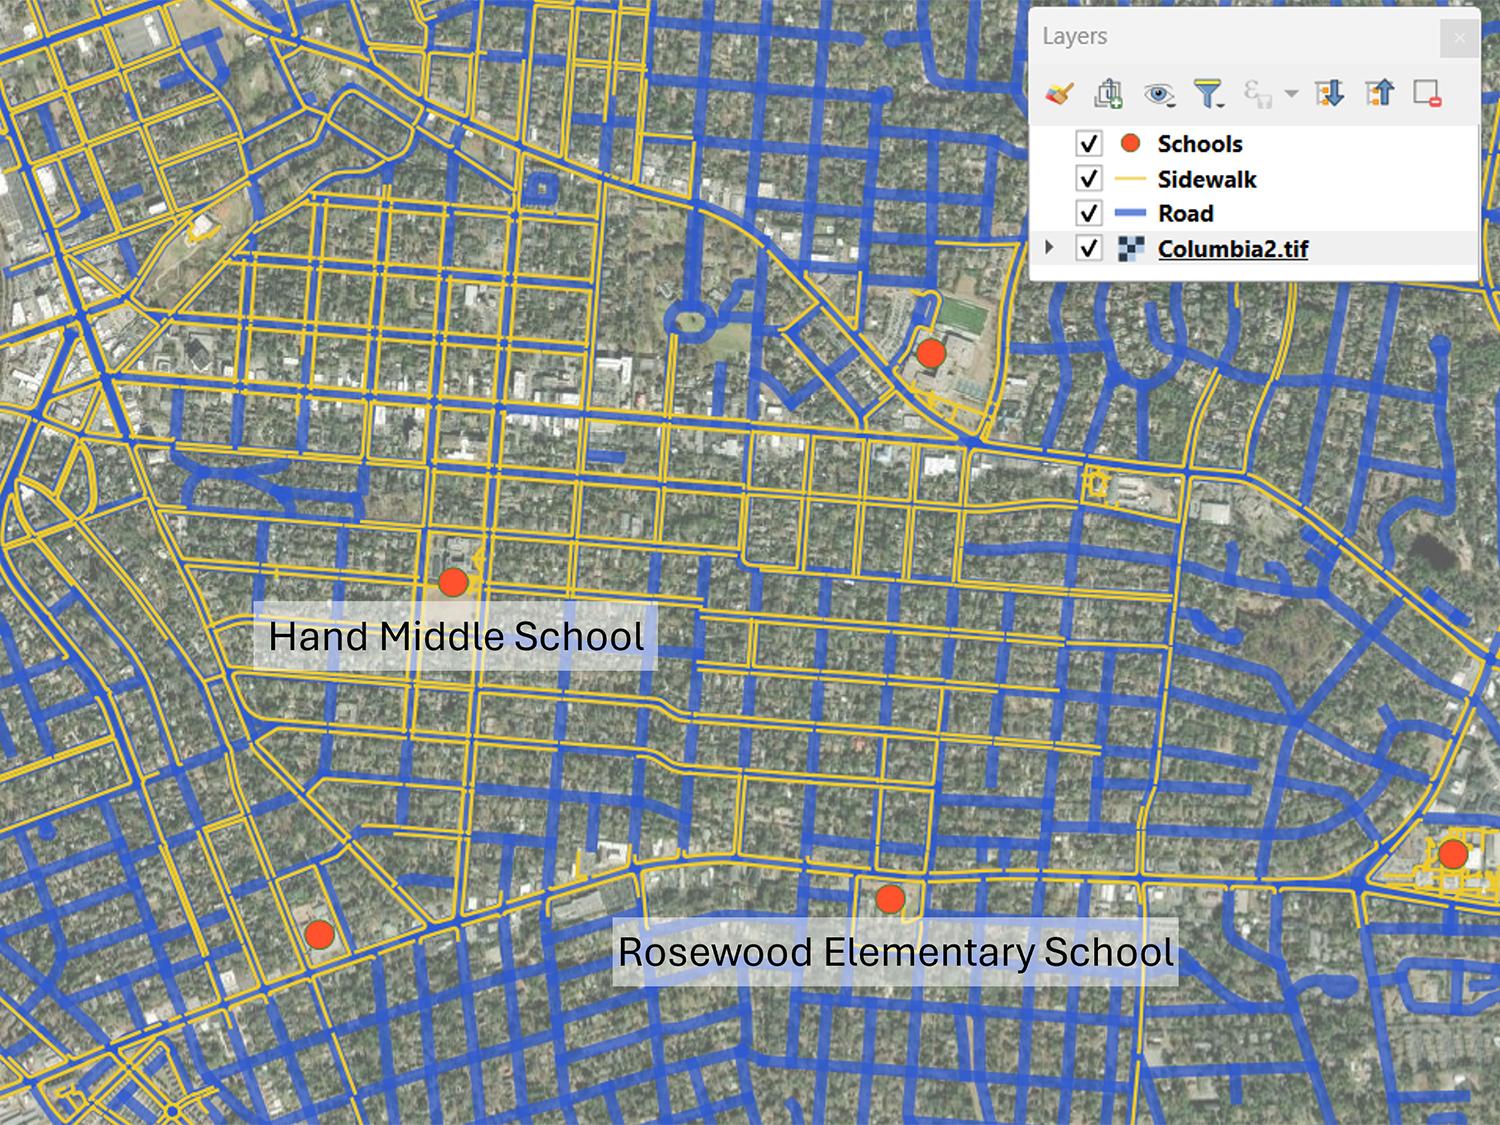
  • Can you please create 2000-feet zones around each health facilities in Washington DC to identify areas of service coverage?
  • Generate contour lines from the DEM of Puerto Rico with a 50-meter interval.

to more complex questions such as

  • Generate an obesity risk behavior index of each county in the contiguous US by analyzing the rate of visits to unhealthy food retailers (such as convenience store, alcoholic drinking places, and limited service restaurant) and the visit rate to places that support physical activity (e.g., sports centers, parks, fitness centers). Visualize the results in a thematic map to highlight the obesity risk behavior index across counties.
  • Could you analyze and visualize the fast food accessibility score for each county based on the number of fast food restaurants and population using a thematic map with blue graduated colors. Then, analyze the correlation between the county-level obesity rate and the fast food accessibility score by drawing a scatter plot with a regression line.

to the development of interactive web mapping applications such as

  • Generate an interactive web map using leaflet for the shown data layer.

The tool’s functionality was rigorously evaluated on more than 100 spatial analysis tasks, categorized into three levels of complexity including Basic Tasks: Single-step operations involving one GIS tool and data layer. Intermediate Tasks: Multi-step processes requiring multiple tools and user guidance. Advanced Tasks: Complex, multi-step analyses where the tool independently determines and executes workflows without explicit user input. Results showed that GIS Copilot excels at automating basic and intermediate tasks, with significant progress in handling advanced workflows. While challenges remain in achieving complete autonomy for highly complex tasks, the tool represents a major step toward the vision of autonomous GIS.

The release of GIS Copilot has sparked massive interest in the geospatial and AI communities. A LinkedIn post announcing the tool has garnered  over 150,000 impressions, 2,200 likes, and more than 220 reposts within just a few days. The overwhelming response reflects the demand for such an GIS Copilot that simplify GIS workflows and enhance accessibility.

GIS Copilot’s source code is available on GitHub, with the plugin downloadable from the official QGIS plugin page. The research team has also made data and case studies used in testing accessible online, inviting collaboration and feedback from the global GIS community.

The GIS Copilot represents a significant milestone in the development of Autonomou GIS by integrating AI with GIS, bridging the gap between technical GIS expertise and practical application. This innovation not only simplifies geospatial workflows but also enhances decision-making across diverse domains such as disaster management, urban planning, and public health.

To learn more about GIS Copilot’s design, implementation, and discussions, please check out our preprint paper.

M. Naser Lessani and Temitope Akinboyewa presented at the Middle States AAG Conference at West Chester University

Two of our PhD students M. Naser Lessani and Temitope Akinboyewa recently attended the Middle States AAG Conference at West Chester University in Pennsylvania, an event that brought together geographers, researchers, and professionals to explore emerging themes and share innovative research within the field. Attendees engaged in discussions on diverse topics, ranging from environmental sustainability to spatial analysis, fostering a collaborative atmosphere for advancing geographic knowledge.

Naser presented his recent research on the computational enhancement of a new geo-regression model (SGWR). Following his presentation, he engaged in insightful discussions with other attendees, including professors, and graduate students, which provided valuable perspectives on expanding the applicability of the newly published regression model. He also had the honor of participating in a panel discussion with esteemed professors and fellow graduate students, adding further depth to his conference experience. Additionally, he had the opportunity to speak with Dr. Gary Coutu, Chair of the Department of Geography at West Chester University, about the impact of emerging technologies in GIS. The conversation focused on how these new technologies can be integrated into geography to deepen our understanding of geospatial analysis.

Temitope Akinboyewa presented his research work titled “GIS Copilot: Towards an Autonomous GIS Agent for Spatial Analysis”. Temitope’s presentation gained significant attention from attendees, resulting in insightful questions and positive feedback on expanding the research applicability across various domains. In addition to his presentation, he participated in a panel session alongside graduate students and faculty members from different institutions. The discussion focused on recent advancements in the field of Geography, along with suggestions for prospective graduate students. The conference also provided an avenue for him to connect with fellow geographers and potential collaborators.

An autonomous GIS agent framework for geospatial data retrieval

Geographic information system (GIS) users and analyst need to fetching geospatial data for analysis or research tasks. Data fetching can be time-consuming and label intensive. Our recent study proposes LLM-Find, an autonomous GIS agent framework to retrieve geospatial data by generating and executing programs with self-debugging. LLM-Find adopts an LLM as the decision maker to pick up the applicable data source from a list and then fetch data from the selected source. Each data source has a pre-defined handbook that records the metadata and technical details for data fetching. The proposed framework is flexible and extensible, designed as a plug-and-play mechanism; human users or autonomous data scrawlers can add a new data source by adding a new handbook. LLM-Find provides a fundamental agent framework for data fetching in autonomous GIS. We also prototyped an agent based on LLM-Find, which can fetch data from OpenStreetMap, COVID-19 cumulative cases from GitHub, administrative boundaries and demographic data from the US Census Bureau, weather data from a commercial provider, satellite basemap from ESRI World Imagery, and worldwid DEM from OpenTopography.org.

We tested various data cases; by accepting data requests in natural language, most of the requests got correct data in an about 80% – 90% success rate. We feel excited about that because the success of such data fetching agent indicates that the data intensive GIS research or boarder scientific research can be executed by agents. Autonomous research agents can collect necessary online or local data and then conduce analysis parallely while adjust methods or strategies for better results. LLM-Find will be a foundational role in such a bright vision.

For more details, please refer to our paper: Ning, Huan, Zhenlong Li, Temitope Akinboyewa, and M. Naser Lessani. 2024. “An Autonomous GIS Agent Framework for Geospatial Data Retrieval” arXiv. https://doi.org/10.48550/arXiv.2407.21024. GitHub repository: https://github.com/gladcolor/LLM-Find 

Further reading: Autonomous GIS: the next-generation AI-powered GIS. Recommended citation format: Li Z., Ning H., 2023. Autonomous GIS: the next-generation AI-powered GIS. International Journal of Digital Earth. GitHub repository: https://github.com/gladcolor/LLM-Geo

Huan Ning attended the National Neighborhood Data Archive (NaNDA) 2024 Summer Workshop

Our Ph.D. student, Huan Ning, attended the National Neighborhood Data Archive (NaNDA) 2024 Summer Workshop on August 14, 2024, at the University of Michigan, Ann Arbor, MI. He presented a project funded by the NaNDA Pilot Grant Award. The project is titled “Developing a Novel Wheelchair Mobility Index for Wheelchair Users using Street View Imagery and Artificial Intelligence”; it aims to develop a wheelchair mobility index at house and neighborhood level using street view images, while the methods created can be extended to a universal built environment auditing toolkit. Huan also shared research ideas about autonomous agents for data analysis, data downloading, and phenomena modeling with the other attendees.

NaNDA data archive collects datasets about the physical, economic, demographic, and social environment at multiple geographic levels, such as census tract, ZIP code tabulation area, and county. Users can access these updated da

tasets from NaNDA’s website. NaNDA was initiated by the Institute for Social Research at the University of Michigan and was founded by the National Institutes of Health/National Institute of Nursing Research and the National Institute and National Institute on Disability, Independent Living, and Rehabilitation Research.


New article: Automated floodwater depth estimation using large multimodal model for rapid flood mapping

Our new article titled “Automated floodwater depth estimation using large multimodal model for rapid flood mapping” is published in Computational Urban Science. 

Read full article here!

Abstract

Information on the depth of floodwater is crucial for rapid mapping of areas affected by floods. However, previous approaches for estimating floodwater depth, including field surveys, remote sensing, and machine learning techniques, can be time-consuming and resource-intensive. This paper presents an automated and rapid approach for estimating floodwater depth from on-site flood photos. A pre-trained large multimodal model, Generative pre-trained transformers (GPT-4) Vision, was used specifically for estimating floodwater. The input data were flood photos that contained referenced objects, such as street signs, cars, people, and buildings. Using the heights of the common objects as references, the model returned the floodwater depth as the output. Results show that the proposed approach can rapidly provide a consistent and reliable estimation of floodwater depth from flood photos. Such rapid estimation is transformative in flood inundation mapping and assessing the severity of the flood in near-real time, which is essential for effective flood response strategies.

Keywords: Flood mapping, Large multimodal model, Large language model, ChatGPT, GeoAI, Disaster management

Akinboyewa, T., Ning, H., Lessani, M.N. et al. Automated floodwater depth estimation using large multimodal model for rapid flood mapping. Comput.Urban Sci. 4, 12 (2024). https://doi.org/10.1007/s43762-024-00123-3


New article: A Sensor-Based Simulation Method for Spatiotemporal Event Detection

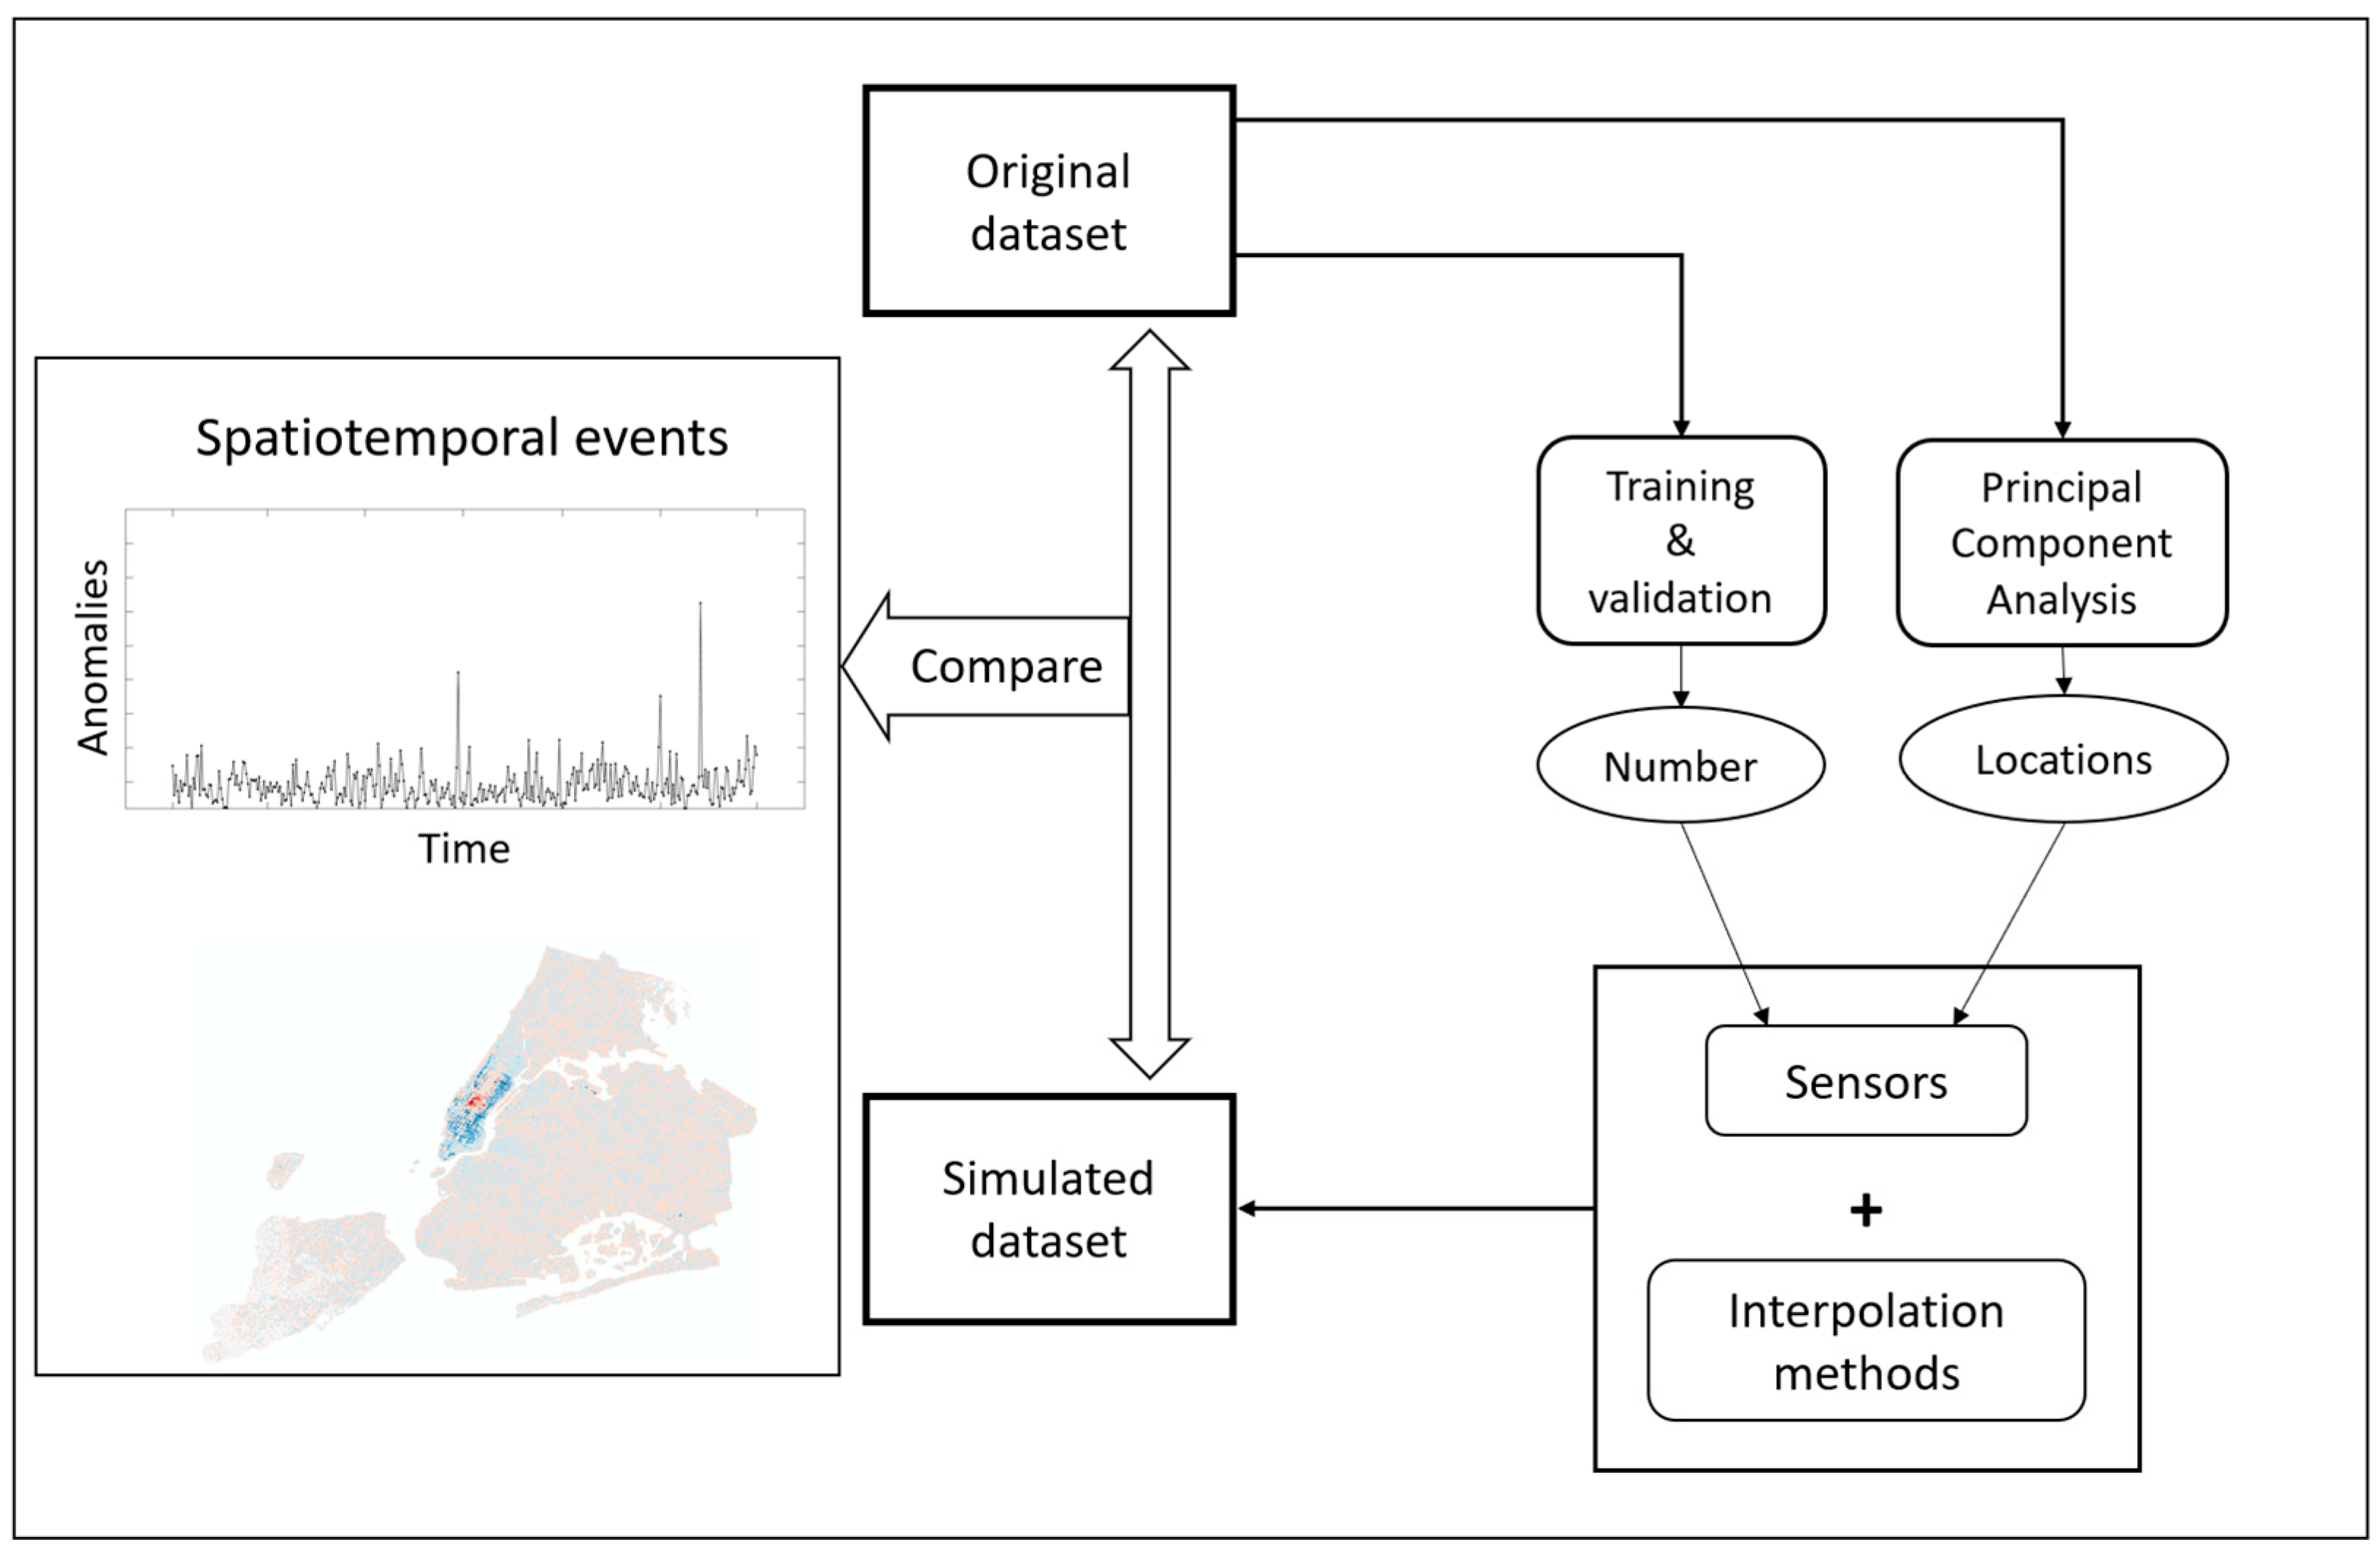
Our new article titled “A Sensor-Based Simulation Method for Spatiotemporal Event Detection” is published in the ISPRS International Journal of Geo-Information. 

Read full article here!

Abstract

Human movements in urban areas are essential to understand human–environment interactions. However, activities and associated movements are full of uncertainties due to the complexity of a city. In this paper, we propose a novel sensor-based approach for spatiotemporal event detection based on the Discrete Empirical Interpolation Method. Specifically, we first identify the key locations, defined as “sensors”, which have the strongest correlation with the whole dataset. We then simulate a regular uneventful scenario with the observation data points from those key locations. By comparing the simulated and observation scenarios, events are extracted both spatially and temporally. We apply this method in New York City with taxi trip record data. Results show that this method is effective in detecting when and where events occur.
Keywords: event detection; human mobility; discrete empirical interpolation method (DEIM); principal component analysis
Ijgi 13 00141 g001
New article “SGWR: similarity and geographically weighted regression” published in the International Journal of Geographical Information Science (IJGIS)

Our new research paper “SGWR: similarity and geographically weighted regression” is published in the International Journal of Geographical Information Science (IJGIS). In this study, we extend the geographically weighted regression (GWR) by integrating attribute similarity alongside the conventional geographically weighted matrix. The new model, called SGWR, was evaluated across various datasets, including housing prices, crime rates, and three health outcomes including mental health, depression, and HIV. Results show that SGWR consistently outperforms the global regression model and the traditional GWR based on several statistical measures across all experimental datasets.

Read the full article (open access) at https://lnkd.in/enejjskZ
Code and datasets are available at https://lnkd.in/e4Yn6xyP
Graphic user interface (GUI) for SGWR is under development. Stay tuned!

GIBD graduate Yuqin Jiang will join University of Hawaii at Manoa as a tenure-track Assistant Professor

We are delighted to share the news that Yuqin Jiang, a recent graduate of GIBD, has accepted a tenure-track Assistant Professor position with the Department of Geography and Environment at the University of Hawaii at Manoa. Yuqin completed her Ph.D. in the summer of 2022, with a dissertation titled “Quantifying Human Mobility Patterns During Disruptive Events with Geospatial Big Data.”

Congratulations, Yuqin, and best wishes for your future endeavors!

New Article: Assessing the 2023 Canadian wildfire smoke impact in Northeastern US: Air quality, exposure and environmental justice

Our new article led by Dr. Manzhu Yu, titled “Assessing the 2023 Canadian wildfire smoke impact in Northeastern US: Air quality, exposure and environmental justice”, is published in the Science of The Total Environment. 

Abstract: The Canadian wildfires in June 2023 significantly impacted the northeastern United States, particularly in terms of worsened air pollution and environmental justice concerns. While advancements have been made in low-cost sensor deployments and satellite observations of atmospheric composition, integrating dynamic human mobility with wildfire PM2.5 exposure to fully understand the environmental justice implications remains under investigated. This study aims to enhance the accuracy of estimating ground-level fine particulate matter (PM2.5) concentrations by fusing chemical transport model outputs with empirical observations, estimating exposures using human mobility data, and evaluating the impact of environmental justice. Employing a novel data fusion technique, the study combines the Weather Research and Forecasting model with Chemistry (WRF-Chem) outputs and surface PM2.5 measurements, providing a more accurate estimation of PM2.5 distribution. The study addresses the gap in traditional exposure assessments by incorporating human mobility data and further investigates the spatial correlation of PM2.5 levels with various environmental and demographic factors from the US Environmental Protection Agency (EPA) Environmental Justice Screening and Mapping Tool (EJScreen). Results reveal that despite reduced mobility during high PM2.5 levels from wildfire smoke, exposure for both residents and individuals on the move remains high. Regions already burdened with high environmental pollution levels face amplified PM2.5 effects from wildfire smoke. Furthermore, we observed mixed correlations between PM2.5 concentrations and various demographic and socioeconomic factors, indicating complex exposure patterns across communities. Urban areas, in particular, experience persistent high exposure, while significant correlations in rural areas with EJScreen factors highlight the unique vulnerabilities of these populations to smoke exposure. These results advocate for a comprehensive approach to environmental health that leverages advanced models, integrates human mobility data, and addresses socio-demographic disparities, contributing to the development of equitable strategies against the growing threat of wildfires.

Read the full article here.


New paper published in Cities: From neighborhood contexts to human behaviors: Cellphone-based place visitation data contribute to estimating neighborhood-level depression prevalence in the United States

Our new paper led by the lab’s Postdoc Researcher Fengrui Jing, titled “From neighborhood contexts to human behaviors: Cellphone-based place visitation data contribute to estimating neighborhood-level depression prevalence in the United States”, is published in Cities, a top interdisciplinary journal focusing on urban planning and policy.

Abstract: The elucidation of neighborhood-level mental illness is pivotal to effective community need assessment and public health interventions. However, aggregating individual behaviors linked to mental health at the neighborhood level has proven to be a challenge. In this study, we collected place visitation data from extensive mobile phone records as a proxy measure of health behaviors to investigate whether and how the place visitation data can contribute to improving the estimation of nationwide neighborhood-level depression prevalence. Using nationwide place visitation data from 2019, we measured eight types of health behaviors at the neighborhood level in the United States, including positive and negative health behaviors (PNHB) and health service utilization behaviors (HSUB). The study revealed that visitations to different types of places of interest (POI) (i.e., fitness visitation, drinking place (alcoholic beverages) visitation, pharmacy visitation, general hospital visitation, and specialty hospital visitation) were significantly associated with neighborhood-level depression. Incorporating cellphone-based place visitation data (i.e., the proxy of health behaviors) into the models enhanced modeling fitness, with the model that included neighborhood context variables exhibiting the strongest fitness, followed by PNHB, POI features, and HSUB variables. These improvements are greater in models for self-reported mental health status compared to depression. The model fitness exhibits spatial differences, with smaller differences between actual and predicted values in urban areas (2.834) compared to rural areas (2.956) and the Midwest (2.212) compared to other regions. Overall, this study represents the first nationwide investigation of the role of cellphone-based place visitation data in estimating neighborhood-level depression prevalence. It expands a novel conceptual framework for explicating neighborhood-level depression prevalence by incorporating neighborhood-level health behaviors.

Keywords: depression; mobile phone data; health behavior; neighborhood; United States

Jing F., Li Z., Ning H., Lessani N., Qiao S., Li X., (2024). From neighborhood contexts to human behaviors: Cellphone-based place visitation data contribute to estimating neighborhood-level depression prevalence in the United States, Cities. https://doi.org/10.1016/j.cities.2024.104905


New paper accepted by Geo-spatial Information Science: An MPI-based parallel genetic algorithm for multiple geographical feature label placement based on the hybrid of fixed-sliding models

Our new paper titled “An MPI-based parallel genetic algorithm for multiple geographical feature label placement based on the hybrid of fixed-sliding models” is accepted by Geo-spatial Information Science.

Abstract: Multiple geographical feature label placement (MGFLP) has been a fundamental problem in geographic information visualization for decades. Moreover, the nature of label positioning has proven to be an NP-hard problem. Although advances in computer technology and robust approaches have addressed the problem of label positioning, the lengthy running time of MGFLP has not been a major focus of recent studies. Based on a hybrid of the fixed-position and sliding models, a Message Passing Interface (MPI) parallel genetic algorithm is proposed in the present study for MGFLP to label mixed types of geographical features. To evaluate the quality of label placement, a quality function is defined based on four quality metrics: label-feature conflict; label-label conflict; label association with the corresponding feature; label position priority for all three types of features. The experimental results show that the proposed algorithm outperforms the DDEGA, DDEGA-NM, and Parallel-MS in both label placement quality and computation time efficiency. Across three datasets, compared to Parallel-MS, running times decreased from 118.45 to 8.34, 45.98 to 3.51, and 20.01 to 0.43 min, with further reductions in label-label and label-feature conflicts.

Keywords: Label placement; fixed position; geographical features; parallel genetic algorithm; Message Passing Interface

To Cite: Lessani M.N., Li Z., Deng J., Guo Z., (2024). An MPI-based parallel genetic algorithm for multiple geographical feature label placement based on the hybrid of fixed-sliding models, Geo-spatial Information Science. https://doi.org/10.1080/10095020.2024.2313326

GIBD lab attended the 5th National Big Data Health Science Center Conference in Columbia, South Carolina

The GIBD lab members, Temitope Akinboyewa, Naser Lessani, Huan Ning, and Zhenlong Li, attended and delivered presentations at the 5th National Big Data Health Science Center Conference in Columbia, South Carolina from Feb. 02 to 03, 2024.

Presentation by Zhenlong Li: Association Between Immigrant Concentration and Mental Health Service Utilization in the United States Over Time: A Geospatial Big Data Analysis.
Presentation by Huan Ning: Estimating Hourly Neighborhood Population Using Mobile Phone Data, 5th National Big Data Health Science Conference.
Presentation by Naser Lessani: Using ChatGPT-4 in literature review: A validation pilot study in the areas of HIV medicine adherence.

New paper published on Plos One: Understanding the bias of mobile location data across spatial scales and over time

Our study on the bias of mobile location data (SafeGraph or Advan) is published in PLOS ONE, a peer-reviewed journal. The smartphone-based human mobility data has been widely used in social research, but still lacked a comprehensive bias investigation for such datasets. Our study provides an understanding and assessment framework for mobility data. Please check out the paper and feel free to contact us for any questions!

Understanding the bias of mobile location data across spatial scales and over time: a comprehensive analysis of SafeGraph data in the United States

Abstract: Mobile location data has emerged as a valuable data source for studying human mobility patterns in various contexts, including virus spreading, urban planning, and hazard evacuation. However, these data are often anonymized overviews derived from a panel of traced mobile devices, and the representativeness of these panels is not well documented. Without a clear understanding of the data representativeness, the interpretations of research based on mobile location data may be questionable. This article presents a comprehensive examination of the potential biases associated with mobile location data using SafeGraph Patterns data in the United States as a case study. The research rigorously scrutinizes and documents the bias from multiple dimensions, including spatial, temporal, urbanization, demographic, and socioeconomic, over a five-year period from 2018 to 2022 across diverse geographic levels, including state, county, census tract, and census block group. Our analysis of the SafeGraph Patterns dataset revealed an average sampling rate of 7.5% with notable temporal dynamics, geographic disparities, and urban-rural differences. The number of sampled devices was strongly correlated with the census population at the county level over the five years for both urban (r > 0.97) and rural counties (r > 0.91), but less so at the census tract and block group levels. We observed minor sampling biases among groups such as gender, age, and moderate-income, with biases typically ranging from -0.05 to +0.05. However, minority groups such as Hispanic populations, low-income households, and individuals with low levels of education generally exhibited higher levels of underrepresentation bias that varied over space, time, urbanization, and across geographic levels. These findings provide important insights for future studies that utilize SafeGraph data or other mobile location datasets, highlighting the need to thoroughly evaluate the spatiotemporal dynamics of the bias across spatial scales when employing such data sources.

Keywords: population bias, human mobility, smartphone data, Advan Patterns, SafeGraph

Paper link:

https://journals.plos.org/plosone/article?id=10.1371/journal.pone.0294430


New article: Crowdsourcing Geospatial Data for Earth and Human Observations: A Review

Our new collaborative article titled “Crowdsourcing Geospatial Data for Earth and Human Observations: A Review” is accepted for publication by the Journal of Remote Sensing. Read the accepted version at: https://spj.science.org/doi/10.34133/remotesensing.0105 

Abstract: The transformation from authoritative to user-generated data landscapes has garnered considerable attention, notably with the proliferation of crowdsourced geospatial data. Facilitated by advancements in digital technology and high-speed communication, this paradigm shift has democratized data collection, obliterating traditional barriers between data producers and users. While previous literature has compartmentalized this subject into distinct platforms and application domains, this review offers a holistic examination of crowdsourced geospatial data. Employing a narrative review approach due to the interdisciplinary nature of the topic, we investigate both human and Earth observations through crowdsourced initiatives. This review categorizes the diverse applications of this data and rigorously examines specific platforms and paradigms pertinent to data collection. Furthermore, it addresses salient challenges, encompassing data quality, inherent biases, and ethical dimensions. We contend that this thorough analysis will serve as an invaluable scholarly resource, encapsulating the current state-of-the-art in crowdsourced geospatial data, and offering strategic directions for future interdisciplinary research and applications across various sectors.


GIBD’s recent work, LLM-Geo, was introduced in the 2023 annual conference of GIS Society of Japan.

GIBD’s recent work, LLM-Geo, was introduced in the 2023 annual conference of GIS Society of Japan. LLM-Geo is a prototype of autonomous GIS that can conduct spatial analysis without human intervention. About 50 GIS professionals tried LLM-Geo in a hands-on session, following a brief introductory presentation by lab member Huan Ning, a PhD student at Penn State. Hands-on participants showed interest in LLM-Geo’s analysis and plotting capability and felt excited about its potential advancements. The GIBD team will continue to improve LLM-Geo. https://www.tandfonline.com/doi/full/10.1080/17538947.2023.2278895

Invitation to submit abstracts for oral and poster presentations at the 5th National Big Data Health Science Conference, to be held February 2-3, 2024, in Columbia, SC.

The 2024 Conference Planning Committee invites you to submit abstracts for oral and poster presentations at the 5th National Big Data Health Science Conference, to be held February 2-3, 2024, in Columbia, SC. Authors will have the option of publishing their abstract in the 2024 Conference Proceedings (with Biomedical Central, a part of Springer Nature) at no cost. Abstracts responsive to the conference theme “Unlocking the Power of Big Data in Health: Empowering Scientific and Healthcare Communities with Data Analytics” will be accepted until December 4, 2023.

The National Big Data Health Science Conference is a signature annual event of the University of South Carolina Big Data Health Science Center. The purpose of the conference is to stimulate advancements in Big Data health science research through rich interdisciplinary collaboration. The conference serves as a multidisciplinary scientific venue for the exchange of new concepts, methods, and results to encourage the sharing of theoretical, methodological, and substantive knowledge from Big Data health sciences research across the stakeholder spectrum. With delegates from industry, academia, and government, the conference promotes an open discussion of critical questions in Big Data health science with particular emphasis on emerging methods which may contribute to the future of healthcare and facilitate the exchange of ideas and findings that could shape the future of Big Data health science. 

Funding for this conference was made possible (in part) by NIH under award R13LM014347 from the National Library of Medicine. The views expressed in written conference materials or publications and by speakers and moderators do not necessarily reflect the official policies of the Department of Health and Human Services; nor does mention by trade names, commercial practices, or organizations imply endorsement by the U.S. Government.

Dr. Chaowei Phil Yang, Professor at George Mason University, will be presenting a seminar at Big Data Health Science Center on “Utilizing Big Spatiotemporal Data to Understand COVID and its Impacts”.

Dr. Chaowei Phil Yang, Professor at George Mason University and the Founding Director of the NSF Spatiotemporal Innovation Center, will be presenting a seminar at the University of South Carolina Big Data Health Science Center, sharing insights on “Utilizing Big Spatiotemporal Data to Understand COVID and its Impacts”. The seminar is scheduled for Wednesday, August 30, at 10:30 AM, Discovery Building RM 140.


“Measuring Global Multi-Scale Place Connectivity using Geotagged Social Media Data” published in nature Scientific Reports

Our article “Measuring Global Multi-Scale Place Connectivity using Geotagged Social Media Data” has published nature Scientific Reports.

Read the article at https://www.nature.com/articles/s41598-021-94300-7 

Abstract: Shaped by human movement, place connectivity is quantified by the strength of spatial interactions among locations. For decades, spatial scientists have researched place connectivity, applications, and metrics. The growing popularity of social media provides a new data stream where spatial social interaction measures are largely devoid of privacy issues, easily assessable, and harmonized. In this study, we introduced a global multi-scale place connectivity index (PCI) based on spatial interactions among places revealed by geotagged tweets as a spatiotemporal-continuous and easy-to-implement measurement. The multi-scale PCI, demonstrated at the US county level, exhibits a strong positive association with SafeGraph population movement records (10% penetration in the US population) and Facebook’s social connectedness index (SCI), a popular connectivity index based on social networks. We found that PCI has a strong boundary effect and that it generally follows the distance decay, although this force is weaker in more urbanized counties with a denser population. Our investigation further suggests that PCI has great potential in addressing real-world problems that require place connectivity knowledge, exemplified with two applications: 1) modeling the spatial spread of COVID-19 during the early stage of the pandemic and 2) modeling hurricane evacuation destination choice. The methodological and contextual knowledge of PCI, together with the launched visualization platform and open-sourced PCI datasets at various geographic levels, are expected to support research fields requiring knowledge in human spatial interactions.

Autonomous GIS: the next-generation AI-powered GIS

Check out our new research proposing Autonomous GIS as the next-generation AI-powered GIS.

Link the full preprint: https://www.researchgate.net/publication/370635187_Autonomous_GIS_the_next-generation_AI-powered_GIS

Code for LLM-Geo: https://github.com/gladcolor/LLM-Geo 

Autonomous GIS: the next-generation AI-powered GIS

Abstract: Large Language Models (LLMs), such as ChatGPT, demonstrate a strong understanding of human natural language and have been explored and applied in various fields, including reasoning, creative writing, code generation, translation, and information retrieval. By adopting LLM as the reasoning core, we introduce Autonomous GIS (AutoGIS) as an AI-powered geographic information system (GIS) that leverages the LLM’s general abilities in natural language understanding, reasoning and coding for addressing spatial problems with automatic spatial data collection, analysis and visualization. We envision that autonomous GIS will need to achieve five autonomous goals including self-generating, self-organizing, self-verifying, self-executing, and self-growing. We developed a prototype system called LLM-Geo using the GPT-4 API in a Python environment, demonstrating what an autonomous GIS looks like and how it delivers expected results without human intervention using two case studies. For both case studies, LLM-Geo returned accurate results, including aggregated numbers, graphs, and maps, significantly reducing manual operation time. Although still lacking several important modules such as logging and code testing, LLM-Geo demonstrates a potential path towards next-generation AI-powered GIS. We advocate for the GIScience community to dedicate more effort to the research and development of autonomous GIS, making spatial analysis easier, faster, and more accessible to a broader audience.

Keywords: Autonomous Agent, GIS, Artificial Intelligence, Spatial Analysis, Large Language Models, ChatGPT


Figure 1. Overall workflow of LLM-Geo


Results automatically generated by LLM-Geo for counting the population living near hazardous wastes. (a) Solution graph, (b) assembly program (Python codes), and (c) returned population count and generated map.

GIBD alumnus Daniel Newsome taken on a new role as a Data Analytics Manager with Rise Interactive

We are pleased to share that GIBD alumnus Daniel Newsome has taken on a new role as a Data Analytics Manager with Rise Interactive! Congratulations, Daniel!

The 3rd ISDE International Lectures where Dr. Zhenlong Li delivered an invited talk along with other two colleagues attracted over 5100 participants worldwide

The 3rd ISDE International Lectures where Dr. Zhenlong Li delivered an invited talk along with other two colleagues attracted over 5100 participants worldwide

The 3rd International Lectures organized by International Society for Digital Earth where Dr. Zhenlong Li delivered an invited talk along with other two colleagues (Prof. Kathleen Stewart from University of Maryland and Prof. Song Gao from University of Wisconsin-Madison) attracted over 5,100 participants worldwide!

“On March 21st, 2023, the 3rd ISDE International Lectures was successfully convened online, enlightening the attendees on the theme of “Human Mobility Analytics in the Big Data Era”. Thanks to the multi-channel exposure, this time’s lecture got more eyes on its discernment in the challenges of, approaches to and feasible techniques for the human mobility measurement, the applications of location-aware mobile device data to travel pattern analysis, as well as the ensuring regularity and privacy issues in human mobility research. Three renowned experts from the United States were invited to deliver lectures.”

The topic for Dr. Li’s presentation is “Measuring Human Mobility with Big Geosocial Data: Challenges and Approaches”.

See full news report here: http://www.digitalearth-isde.org/show-48-249-1.html

Dr. Zhenlong Li receives funding from Taylor Geospatial Institute to develop a SMART geospatial tool to classify building archetype at community level towards Digital-Twins of Disaster Resilience

Dr. Zhenlong Li (Institutional PI) and Dr. Grace Yan from Missouri S&T (PI) receive $190,000 funding from Taylor Geospatial Institute for a new project titled “Developing a SMART Geospatial Tool to Classify Building Archetype at Community Level towards Digital-Twins of Disaster Resilience (DTDR)“.

Project Goal: To achieve intergenerational, equitable resilience under the changing climate (society sustainability), considering the uncertainties in projecting future natural hazards, the overarching goal of this project is to develop powerful, evolving Digital-Twins for Disaster Resilience (DTDR), with cutting-edge GeoSpatial tools and engineering and social science breakthrough discoveries integrated. The DTDR will create future potential climate/hazard scenarios and embed potential engineering hardening approaches and nature-based solutions for hazard mitigation. It will allow stakeholders to experiment with hazard mitigation solutions and practice evidence-based decision making on resilience planning and implementation. This will eventually lead to intergenerational, equitable resilience policy for both physical/social subsystems, empowering communities to confront current and future natural hazards.

Joint Special Issue by IJGI and Remote Sensing: Harnessing the Geospatial Data Revolution for Promoting Sustainable Transport Systems

Special Issue Editors

E-Mail Website
Guest Editor

Transport Studies Unit, University of Oxford, Oxford OX1 3QY, UK
Interests: GIS; spatial data science; transport geography; mobility analytics

E-Mail Website
Guest Editor

Department of Geosciences, University of Arkansas, Fayetteville, AR 72701, USA
Interests: spatial analysis, remote sensing, human–environment interactions, social sensing, deep learning
Special Issues, Collections and Topics in MDPI journals
Department of Geography, University of South Carolina, Columbia, SC 29208, USA
Interests: GIScience; geospatial big data; spatial computing; GeoAI
Special Issues, Collections and Topics in MDPI journals


Dear Colleagues,

A sustainable transport system plays a vital role in a successful society, the construction and operation of which require the support of considerable amounts of transport data from a variety of sources to inspect road asset conditions; track traffic flow dynamics; monitor transport emergencies; analyse traffic safety, equality, and accessibility, etc. With the advancement of new and scalable data sources, robust acquisition methodologies, and transmission techniques, unprecedented amounts of traffic information are being generated and collected from various data sources, such as roadside sensors, very-high-resolution (VHR)/HR satellite imagery, streetscape observations, sensor-rich mobile devices, and connected and autonomous vehicles (CAVs). Compared with conventional data sources, these emerging geospatial big datasets are massive in size, spatiotemporally fine-scaled, and high-dimensional (e.g., multivariate and multivalued), providing researchers with rich and timely information to effectively manage transport systems and gain new insights into different transport challenges (e.g., crashes, congestion, emissions, mobility inequality). However, managing and analysing these big complex datasets expose new problems and challenges in terms of strategies to promote multiple aspects, including (1) data integration, enrichment, storage, archiving, and sharing; (2) data quality control (e.g., reducing data uncertainty and redundancy); (3) data security, integrity, and privacy; and (4) data processing, analysis, and visualization.

This Special Issue invites the submission of original research papers and review articles that showcase the latest developments, innovations, and applications of emerging transport data in sustainable transport management and operations. Topics of interest include but are not limited to:

  • Application of emerging geospatial data in road asset recognition, digitization, and inventorization.
  • Application of emerging geospatial data in transport equity and accessibility, including environmental policy assessments.
  • Application of new geo-visualization methods and platforms for exploring big transport data.
  • Strategies for encouraging transport data sharing and protecting data privacy and security.
  • Multi-source data fusion challenges and considerations in transport applications.
  • Examining the role of geospatial big data in enhancing resilience and emergency responses for transport systems in the face of natural disasters, pandemics, and other crises.

Manuscript Submission Information

Manuscripts should be submitted online at www.mdpi.com by registering and logging in to this website. Once you are registered, click here to go to the submission form. Manuscripts can be submitted until the deadline. All submissions that pass pre-check are peer-reviewed. Accepted papers will be published continuously in the journal (as soon as accepted) and will be listed together on the special issue website. Research articles, review articles as well as short communications are invited. For planned papers, a title and short abstract (about 100 words) can be sent to the Editorial Office for announcement on this website.

Submitted manuscripts should not have been published previously, nor be under consideration for publication elsewhere (except conference proceedings papers). All manuscripts are thoroughly refereed through a single-blind peer-review process. A guide for authors and other relevant information for submission of manuscripts is available on the Instructions for Authors page. Remote Sensing is an international peer-reviewed open access semimonthly journal published by MDPI.

Please visit the Instructions for Authors page before submitting a manuscript. The Article Processing Charge (APC) for publication in this open access journal is 2500 CHF (Swiss Francs). Submitted papers should be well formatted and use good English. Authors may use MDPI’s English editing service prior to publication or during author revisions.

https://www.mdpi.com/journal/remotesensing/special_issues/1Z7K8V08B5

New article published: Revealing geographic transmission pattern of COVID-19 using neighborhood-level simulation with human mobility data and SEIR model: A case study of South Carolina

Our new article entitled “Revealing geographic transmission pattern of COVID-19 using neighborhood-level simulation with human mobility data and SEIR model: A case study of South Carolina” led by PhD Candidate Huan Ning is published in the International Journal of Applied Earth Observation and Geoinformation (IF: 7.672) by Elsevier.  The article is freely available at https://www.sciencedirect.com/science/article/pii/S1569843223000687

Abstract: Direct human physical contact accelerates COVID-19 transmission. Smartphone mobility data has emerged as a valuable data source for revealing fine-grained human mobility, which can be used to estimate the intensity of physical contact surrounding different locations. Our study applied smartphone mobility data to simulate the second wave spreading of COVID-19 in January 2021 in three major metropolitan statistical areas (Columbia, Greenville, and Charleston) in South Carolina, United States. Based on the simulation, the number of historical county-level COVID-19 cases was allocated to neighborhoods (Census block groups) and points of interest (POIs), and the transmission rate of each allocated place was estimated. The result reveals that the COVID-19 infections during the study period mainly occurred in neighborhoods (86%), and the number is approximately proportional to the neighborhood’s population. Restaurants and elementary and secondary schools contributed more COVID-19 infections than other POI categories. The simulation results for the coastal tourism Charleston area show high transmission rates in POIs related to travel and leisure activities. The results suggest that neighborhood-level infectious controlling measures are critical in reducing COVID-19 infections. We also found that households of lower socioeconomic status may be an umbrella against infection due to fewer visits to places such as malls and restaurants associated with their low financial status. Control measures should be tailored to different geographic locations since transmission rates and infection counts of POI categories vary among metropolitan areas.

Dr. Zhenlong Li is invited to give an online talk at the 3rd ISDE International Lectures on 21 March, 2023

Dr. Zhenlong Li is invited to give an online talk titled “Measuring Human Mobility with Big Geosocial Data: Challenges and Approaches” at the 3rd ISDE International Lectures on 21 March, 2023.

“ISDE International Lectures, organized by the International Society for Digital Earth (ISDE) are a series of online events which feature invited lectures by well-known international experts in the field of Digital Earth. The event will invite speakers to give lectures every two months. The purpose of the events is to bring international scholars in the relevant research fields of Digital Earth together to exchange academic perspectives, share research results, and disseminate the most cutting-edge and authoritative concept of Digital Earth.”

More about this event: http://www.digitalearth-isde.org/show-48-242-1.html

Image preview

Dr. Zhenlong Li receives funding from South Carolina Department of Social Services (SCDSS) to analyze the accessibility of children and youth foster care in South Carolina

South Carolina has a shortage of providers, and many children must be placed away from their original communities. This makes it difficult for birth parents, for children, for visitation and for providing health care. This project aims to produce statistics and maps on the distances from the children and youth original “home address” to their current foster care “provider” address and the distances from the child to the county office and from the provider to the county office for the South Carolina Department of Social Services (SCDSS). While SCDSS understands that many children and youth are placed outside of their county of origin, this project will provide additional insights and specificity.

GIBD members have organized a series of sessions on geospatial big data and spatial computing at 2023 AAG Annual Meeting

GIBD members have organized a series of sessions and will deliver a number of presentations on geospatial big data and spatial computing at the Symposium on Harnessing the Geospatial Data Revolution for Sustainability Solutions, 2023 AAG Annual Meeting. All sessions are now accepting abstracts. We welcome your contributions.

  • Big Data Computing for Geospatial Applications I

https://aag.secure-platform.com/aag2023/solicitations/39/sessiongallery/5738

  • Big Data Computing for Geospatial Applications II

https://aag.secure-platform.com/aag2023/solicitations/39/sessiongallery/6292

  • Human Mobility Analytics in Big Data Era
  • Harnessing Geospatial Big Data for Infectious Diseases
  • Social Sensing and Big Data Computing for Disaster Management
  • Urban Sensing and Understanding via Big Data and GeoAI

https://aag.secure-platform.com/aag2023/solicitations/39/sessiongallery/5740

  • Harnessing Geospatial Big Data for Mental Health Issues

https://aag.secure-platform.com/aag2023/solicitations/39/sessiongallery/5751

  • Multimodal Learning with Geospatial Big Data

https://aag.secure-platform.com/aag2023/solicitations/39/sessiongallery/5667

  • Uncertainties in Big Data Analytics in Disaster Research

https://aag.secure-platform.com/aag2023/solicitations/39/sessiongallery/6065


Big Data Computing for Geospatial Applications

Organizer(s): 

Zhenlong Li   University of South Carolina​​

Qunying Huang  University of Wisconsin-Madison

Eric Shook  University of Minnesota

Wenwu Tang  University of North Carolina at Charlotte

Chair(s):
Zhenlong Li  University of South Carolina

Call for Participation:

The convergence of big data and geospatial computing has brought challenges and opportunities to GIScience with regards to geospatial data management, processing, analysis, modeling, and visualization. Earth observation systems and model simulations are generating massive volumes of disparate, dynamic, and geographically distributed geospatial data with increasingly finer spatiotemporal resolutions. Meanwhile, the ubiquity of smart devices, location-based sensors, and social media platforms provide extensive geo-information about daily life activities. Efficiently analyzing those geospatial big data streams enables us to investigate complex patterns and develop new decision-support systems, thus providing unprecedented values for sciences, engineering, and business. However, handling the “Vs” (volume, variety, velocity, veracity, and value) of geospatial big data is a challenging task as they often need to be processed, analyzed, and visualized in the context of dynamic space and time. This section aims to capture the latest efforts on utilizing, adapting, and developing new computing approaches, spatial methods, and data management strategies to tackle geospatial big data challenges for supporting geospatial applications in different domains such as climate change, disaster management, human dynamics, public health, and environment and engineering.

Potential topics include (but are not limited to) the following:
• Geo-cyberinfrastructure integrating spatiotemporal principles and advanced computational technologies (e.g., high-performance computing, cloud computing, and deep learning/GeoAI).
• New computing and programming frameworks and architecture or parallel computing algorithms for geospatial applications.
• New geospatial data management strategies and data storage models coupled with high-performance computing for efficient data query, retrieval, and processing (e.g., new spatiotemporal indexing mechanisms).
• New computing methods considering spatiotemporal collocation (locations and relationships) of users, data, and computing resources.
• Geospatial big data processing, mining and visualization methods using high-performance computing and artificial intelligence.
• Other research, development, education, and visions related to geospatial big data computing.

To present a paper in the session, please submit your abstract online, and email your abstract code, paper title, and abstract to one of following organizers by Nov. 11, 2022.

https://aag.secure-platform.com/aag2023/solicitations/39/sessiongallery/5738


Harnessing Geospatial Big Data for Infectious Diseases

Organizer(s): 

Zhenlong Li   University of South Carolina​​​​​

Fengrui Jing  University of South Carolina

Shengjie Lai  University of Southampton

Bo Huang  Chinese University of Hong Kong

Chair(s):
Zhenlong Li  University of South Carolina

Call for Participation:

Public health is inextricably linked to geospatial context. Where, when, and how people interact with natural, social, built, economic and cultural environments directly influence human health outcomes, policy making, planning and implementation, especially for infectious diseases such as COVID-19, HIV, and influenza. Geospatial data has long been used in health studies, dating back to John Snows’ groundbreaking mapping of cholera outbreaks in London, and continuing today in a wide range of scientific inquiries, e.g., examining the effects of environmental, neighborhood, and demographic factors on health outcomes, understanding accessibility and utilization of health services, modeling the spread of infectious diseases, assessing the effectiveness of disease interventions, and developing better healthcare strategies to improve health outcomes and equity.

Emerging sources of geospatial big data, such as data collected from social sensing, remote sensing, and health sensing (health wearables) contain rich information about the environmental, social, population, and individual factors for health that are not available in traditional health data and population statistics. Along with innovative spatial and computing methodologies in GIScience, geospatial big data provides unprecedented opportunities for advancing the infectious disease research. The ongoing COVID-19 pandemic further highlights the demand on and the power of big data and spatial analysis in modeling, simulating, mapping, and predicting the spread of infectious diseases and their intervention across the world.

Along these lines, this session aims to capture recent advancements in leveraging geospatial big data and spatial analysis in infectious disease-related research, such as disease mapping and cluster detection, early detection and warning of disease outbreaks, and spatial analysis and modeling of disease spread and control. Potential topics include (but are not limited to) the following:
• Collection, processing, and integration of geospatial big data (e.g., satellite images, floor plans, 3D models, social media and mobile phone data) with health big data (e.g., electronic medical records) to extract geospatial context at various spatiotemporal scales (e.g., environmental risks, socioeconomic factors, and population mobility) to address infectious disease questions.
• Innovative methodologies for geospatial big data analytics in the context of infectious diseases, including geocomputation algorithms and geostatistical models. For example, assessing the effectiveness of non-pharmaceutical interventions in preventing the resurgence of COVID-19 using human mobility data.
• Combining geospatial big data with advanced computing technologies such as machine learning (ML) and geospatial artificial intelligence (GeoAI) to uncover hidden patterns and new information in infectious diseases related to, for example, the spreading, disparity, morbidity, and mortality of COVID-19.
• Developing accessible and reusable geovisualization and mapping methods, sharable data products, and online tools that help foster multidisciplinary collaborations, engage community and facilitate public understanding and decision making during disease outbreaks such as the COIVD-19 pandemic.

To present a paper in the session, please submit your abstract online, and email your abstract code, paper title, and abstract to one of following organizers by November 11, 2022.

https://aag.secure-platform.com/aag2023/solicitations/39/sessiongallery/5739


Human Mobility Analytics in Big Data Era

Organizer(s): 

Naser Lessani   University of South Carolina​​​​​

Zhenlong Li  University of South Carolina

Huan Ning  University of South Carolina

Chair(s):
Naser Lessani  University of South Carolina

Call for Participation:

Human movement and migration have expanded significantly over the last decades, and it imposed great challenges on human societies. Understanding the patterns of human mobility helps to address the existing challenges in urban planning, the spread of infectious diseases, traffic forecasting, climate change, public health, disaster management, and human behavior. As we have witnessed during the Covid-19 pandemic, during this period, investigating human movement became more urgent than ever before to forecast and illustrate how this leads to the spread of Coronavirus disease and more importantly how to prevent further transmission. In the meantime, human mobility data became available for researchers and communities on a huge scale; it has provided opportunities and also given rise to challenges regarding how to analyze, how to create comprehensive models, extract practical knowledge, and visualize these rich resources. For instance, social media services nurture extensive geo-location information regarding daily activities, such as Twitter, Facebook, Instagram, and other smart devices. Effectively utilizing these resources enable us to reveal how human move along networks, and its influences on societies, and provides insightful information for people across various sectors to make better decision and adapt to a rapidly changing world. However, constructing informative information is not straightforward in human mobility data, working with it is a complex and challenging undertaking. Furthermore, since geo-location data contains space and time dimensions, thus, the complexity and computation time of its analysis is burdensome. On the other hand, maintaining individual privacy is of the utmost importance when studying human movement at the individual level.

This session aims to welcome up-to-date approaches addressing human mobility in a broad range: developing new models handling geospatial big data with regard to human movement, data management tools, addressing the importance of investigating human movement patterns in public health, environment, challenges and existed biases in human mobility data, the application of high-performance computing technologies in this domain, and how enterprises across different sectors are leveraging human mobility data to develop strategies to studies changes in human behavior. Or global mental health and human mobility, and studying current and future human movement patterns to meaningful policies and practices. However, the domain is unrestricted to the aforementioned topics, and studies related to human movement are welcomed.
To present a paper in the session, please submit your abstract online (https://www.aag.org/events/aag2023/ ), and email your abstract code, paper title, and abstract to one of the following organizers by November 11, 2022.

https://aag.secure-platform.com/aag2023/solicitations/39/sessiongallery/5741


Social Sensing and Big Data Computing for Disaster Management

Organizer(s): 

Zhenlong Li   University of South Carolina
​​​​Naser Lessani  University of South Carolina

Qunying Huang  University of Wisconsin-Madison

Christopher Emrich  University of Central Florida

Chair(s):
Zhenlong Li  University of South Carolina

Call for Participation:

Rapid onset disasters, often difficult to prepare for and respond to, make disaster management a challenging task worldwide. Disaster and emergency management effectiveness depends heavily on making good decisions in near-real time under extreme duress. These key, often life-saving, decisions are possible only with real-time data sources and the ability to timely collect, process, synthesize, and analyze these multi-sourced data. Traditional data collection practices such as remote sensing and field surveying often fail to offer timely information during or immediately following damaging events. For example, stream gauges are only useful for flood mapping while the stations are functioning properly and before they are overtopped by floodwaters and rendered inoperable.

Fortunately, sharing information such as texts, images, and videos through social media platforms enables all citizens to become part of a large sensor network and a homegrown disaster response team. Compared to traditional physical sensors, such a citizen-sensor network (social sensing) is low cost, more comprehensive, and always broadcasting situational awareness information. For example, with social sensing, massive amounts of micro-level disaster information (e.g., site specific damage) can be captured in real-time through social media platforms (e.g., Twitter, Facebook) and voluntarily reported via dedicated crowdsourcing applications (volunteered geographic information, VGI), enabling rapid assessment of evolving disaster situations. On the other hand, data collected with social sensing is often massive, heterogeneous, noisy, unreliable, and comes in continuous streams. This is inherent “Big Data”, for example, millions of microblog posts from different social media platforms can be generated in a short time right after an impactful disaster. Hence, Big Data computing methods and technologies such as cloud computing, distributed geo-information processing, spatial statistics/modeling, data mining, spatial database, and multi-source data fusion become critical components of using social sensing to understand the impact of and response to the disaster events in a timely fashion.

Along these lines, this session on “Social Sensing and Big Data Computing for Disaster Management” aims to capture the insights in and bring up the discussion of leveraging social sensing and big data computing for supporting disaster management in one or more disaster phases (mitigation, preparedness, response, and recovery).

To present a paper in this session, you will register and submit your abstract online. Then email your presenter identification number (PIN) to one of the following organizers by November 11th, 2022.
https://aag.secure-platform.com/aag2023/solicitations/39/sessiongallery/5742


Urban Sensing and Understanding via Big Data and GeoAI

Organizer(s): 
Huan Ning   University of South Carolina
​​​​​Zhenlong Li  University of South Carolina

Fengrui Jing  University of South Carolina

Chair(s):

Huan Ning  University of South Carolina

Call for Participation:

Billions of people live in cities. They organize themself to create civilization and enjoy their products that come from tremendous collaboration. Cities are complex organisms, and urban life is deeply rooted in the dynamic patterns of cities. Humans create a better life by building better cities. In this progress, there is an essential need to sense the impulse of the city matrix, i.e., urban sensing, which refers to the technologies to sense and acquire dynamic patterns of city and human behaviors in the urban space. The ultimate goal of urban sensing is to build prosperous, sustainable, and equitable cities. To serve this goal, the scientific and engineering communities have responsibility to innovate theories and practices to monitor, analyze, model, predict, and intervene the urban phenomena.

Emerging geospatial big data, such as remote sensing imagery, street view images, social media, and human mobility, are major observations in urban sensing. Analyzing these observations bring technical challenges, such as data acquisition, management, and mining. Recent progress of artificial intelligence for geospatial data (GeoAI) has proven to be powerful tool for information/knowledge extraction from big data. We believe that geospatial big data and GeoAI are among the most promising approaches to address the technical challenges in contemporary urban sensing. This session aims to capture the recent advancements in using geospatial big data/GeoAI to sense and understand urban environments, including conceptualization, knowledge framework, toolbox organization, and applications.

Potential topics include, but are not limited to, the following:
• Exploration of the definitions and sources of urban geospatial big data
• Spatiotemporal scales of geospatial big data in urban settings
• Technology on capturing, storing, processing, and analyzing urban geospatial big data
• Geo-senor network and Internet of things
• Human mobility trajectories
• Urban hazard vulnerability assessment and emergency response
• General data processing and analyzing frameworks for urban geospatial big data
• Social or physical phenomena mining, modeling, and visualization in urban areas using geospatial big data
• Data representation and fusion of multi-modality observations in urban environments, such as images, text, sound, demography, and activities in cyberspace
• Privacy policies of urban geospatial big data
• Interdisciplinary applications based on urban geospatial big data, such as public health

To present a paper in this session, you will register and submit your abstract online (https://www2.aag.org/aagannualmeeting/). Then email your presenter identification number (PIN) to one of the following organizers by November 11th, 2022.

https://aag.secure-platform.com/aag2023/solicitations/39/sessiongallery/5740


Harnessing Geospatial Big Data for Mental Health Issues

Organizer(s): 
Fengrui Jing   University of South Carolina
​​​​Zhenlong Li  University of South Carolina

Huan Ning  University of South Carolina

Shan Qiao  University of South Carolina

Chair(s):
Fengrui Jing  University of South Carolina

Call for Participation:

Mental health issues significantly impact individuals’ life, such as physical health conditions, school or work performance, as well as relationships with family and friends. For society, mental health issues impact social security and economic development. Depression and anxiety are two of the most common mental health conditions, with a combined annual cost of $1 trillion to the global economy. Mental health issues are currently on the rise globally. According to the United Nations, mental health issues now affect approximately 20% of children and adolescents worldwide, suicide is the second leading cause of death among 15-29-year-olds, and approximately 1 in 5 people in post-conflict settings suffer from a mental health condition.
Questionnaires, census data, and medical records have traditionally been used extensively in various aspects of mental health research. However, using traditional data still presents challenges, including data update periods, dataset accessibility, and data volumes. Emerging geospatial big data addresses these drawbacks due to its large data volume, rich attributes, ease of access, and high spatial and temporal resolution. The relationship between the environment and mental health, as well as the development of place-based policies for mental health surveillance, prediction, and intervention, necessitate the use of geospatial data. Geospatial big data is thus being used in various mental health studies, such as the relationship between environmental exposure and mental health using street view imagery, regional mental health status monitoring using social media data, and mental health service utilization analysis using social media apps.

This session seeks to capture recent advances in the use of geospatial big data and spatial analytics in mental health-related research, such as depression prevalence mapping, neighborhood-level depression surveillance, intervention, and prediction, and mechanism interpretation and analysis of mental health issues. Possible topics (but are not limited to) are the examples listed below.
• Utilizing geospatial big data (e.g., satellite images, street views, social media, mobile phone data, and traffic data) to extract geospatial contexts (e.g., environmental exposure, socioeconomic features, and human mobility) and mental health-related outcomes (e.g., subjective well-being and mental health service utilization) at various spatiotemporal scales to address theoretical questions related to mental health, such as the relationship between environmental exposure, human mobility, and mental health.
• Integrating sophisticated geostatistical techniques and geospatial big data to address practical questions related to mental health. For example, combing geospatial big data with advanced computational techniques such as machine learning (ML) and deep learning (DL) to use human mobility data and street-view environmental exposure data for mental health prevalence prediction at fine spatiotemporal levels, or to use social media data for suicide intervention.
• Developing accessible, participatory, and shareable mental health-related geovisualization approaches, data products, and online tools to serve researchers from various disciplines, the public from various backgrounds, and to aid communities, businesses, governments, and stakeholders in decision-making, such as site selection tools for mental health clinics.

To present a paper in this session, you will register and submit your abstract online (https://www2.aag.org/aagannualmeeting/). Then email your presenter identification number (PIN) to one of the following organizers by November 11th, 2022.


Multimodal Learning with Geospatial Big Data

Organizer(s): 
Meiliu Wu   University of Wisconsin-Madison
​​​​Qunying Huang  University of Wisconsin-Madison

Xiao Huang  University of Arkansas

Zhenlong Li  University of South Carolina

Alexander Michels  University of Illinois Urbana-Champaign

Jinwoo Park  Texas A&M University

Song Gao  University of Wisconsin-Madison

Call for Participation:

Geospatial Big Data technology has been one of the key engines driving the new academic and industrial revolution. However, the majority of current Geospatial Big Data research efforts have been devoted to single-modal data analysis, leading to a huge gap in performance when algorithms are carried out separately. Although significant progress has been made, single-modal geospatial data is often insufficient to derive accurate and robust models in many geospatial applications.
In fact, multimodal is the most general form of geographic information representation and delivery in the real world. Using geospatial multimodal data is natural for humans to make accurate perceptions and decisions, as our digital world is essentially multimodal, combining different modalities of data (e.g., text, audio, images, and videos). Multimodal data analytics algorithms often outperform single-modal data analytics in many geospatial problems and applications. In particular, in the context of geospatial artificial intelligence (GeoAI) and machine learning (ML), we see the demand for spatially explicit multimodal learning as better ways to design AI/ML models by incorporating spatial knowledge and spatial inductive bias (e.g., spatial dependence and spatial heterogeneity) from geospatial multimodal data.
Similarly, multi-sensor geospatial information fusion has also been a topic of great interest in both academic and industrial fields. Organizations and institutions working on remote sensing applications, smart cities, urban computing, human dynamics, disaster resilience, or land use and land cover mapping have grown exponentially. They are attempting to automate processes by using a wide variety of geospatial information from various sources. Meanwhile, many geospatial problems have witnessed huge advancements with multimodal learning, such as geospatial knowledge and semantics mining, geographic question answering, and urban scene understanding.
With the rapid development of Geospatial Big Data technology and its remarkable applications in many fields, multimodal learning with Geospatial Big Data is a timely topic. This session aims to serve as a forum for researchers to share their recent advances in this promising topic, and to seek more interdisciplinary interaction and collaboration in its development.
To present your work in this session, you will register and submit your abstract to the AAG annual meeting website, and email your presenter identification number (PIN) and the abstract to Meiliu Wu (mwu233@wisc.edu) by Nov 11, 2022 along with your preference for an in-person or virtual presentation. Should you have any questions, please don’t hesitate to reach out to the session organizers.

In this session, we welcome submissions broadly contributing to the research on multimodal learning with geospatial big data. Multimodal learning algorithm design and developments tailored on geospatial big data are particularly welcome. The goal of this session is to solicit original contributions of recent findings in theory, methodologies, and applications in the field of multimodal learning with geospatial big data. The list of topics includes, but not limited to:
• Multimodal modeling with geospatial big data
• Geospatial cross-modal learning
• Contrastive learning with geospatial multimodal data
• Spatial analytics and geovisualization with multimodal big data
• Geospatial multimodal data fusion and data representation
• Geospatial multimodal big data infrastructure and management (e.g., data quality, uncertainties, and validation)
• Multimodal scene understanding
• Geospatial multimodal perception and interaction
• Geospatial multimodal benchmark datasets and evaluations
• Geospatial multimodal information tracking, retrieval and identification
• Multimodal learning for geospatial object localization, detection, classification, recognition and segmentation (e.g., remote sensing imagery processing, street view imagery analysis)
• Language and vision in the geospatial domain (e.g., geospatial knowledge and semantics mining, geographic question answering, and urban scene understanding)
• Geospatial multimodal applications (e.g., smart cities, urban computing, human dynamics, disaster resilience, land use and land cover mapping)


Uncertainties in Big Data Analytics in Disaster Research

Organizer(s): 

• Bandana Kar, AAAS Science, Technology and Policy Fellow at the U.S. Dept. of Energy (bandana.kar@ee.doe.gov)
• T. Edwin Chow, Texas State University (chow@txstate.edu)
• Zhenlong Li, University of South Carolina (zhenlong@sc.edu)
• Qunying Huang, University of Wisconsin (qhuang46@wisc.edu)

Call for Participation:

The growth of information and communication technologies (ICT) has enabled citizen participation in scientific investigation (a.k.a. citizen science) and sharing of data and information via social media (e.g., Twitter), and social networking sites (e.g., Facebook), and Wikis (e.g., OpenStreetMap) which enables the public to share and edit geographic data and maps. The advancements in Internet of Things (IoTs) and connected devices including drones and aerial robotics have enabled the use of social media citizen generated big data to understand human dynamics, and their interaction with the built environments. Significant advancements have been made to collect and analyze these data for emergency response, risk communication, mobility studies among others.

The big data derived from citizen sensors tend to suffer from a myriad of uncertainties in terms of positional accuracy, context ambiguity, credibility, reliability, representativeness and completeness. Moreover, there are also serious concerns about data provenance and privacy. While there is no shortage in big data applications, the quality issue of these data remains an intellectual and practical challenge. A lack of data provenance for these data combined with unavailability of high-quality reference data appropriate to its enormous volume, heterogeneous structure in near real-time make it difficult to evaluate the quality of these data. Moreover, the notion of “ground truth” in social science research is subjected to the discourse of space-place dichotomy, the spatial and contextual randomness in human behaviors. The heterogeneous nature of these data in terms of data structure and content requires a tremendous amount of processing at various stages of analytics before the data could be integrated with other geospatial datasets for decision-making purposes. Privacy awareness is of increasing importance to data management, dissemination and distribution in many research projects. Although aggregation, permutation or masking techniques can be used to protect data privacy without compromising the overall quality of data, its effectiveness depends on the degree of distribution heterogeneity of the geographic phenomenon.

This session welcomes basic and empirical research that advances existing understanding and techniques to address the quality issue of big data generated from social media and its impact on applications pertaining to human dynamics, built environments and hazards. Possible topics may include but are not limited to:

• Quality issues in social media big data
• Challenges in collecting, processing and analyzing big data for real-time applications
• Big data quality and its impact in decision making
• Calibration and validation techniques/approaches in big data
• Data fusion of multi-source and/or heterogeneous datasets
• Big data analytics in hazards and built-environment
• Big data analytics in human movements and behaviors during disasters
• Geo-visualization techniques to analyze and visualize social media data
• Privacy and big data management
• Provenance and metadata generation
• Applications of machine-learning and computer vision in disaster research
• New methods to measure social media credibility of social media content and users
• Influential social media user detection

If interested in participating in this session, please send the confirmation of a successful abstract submission to us by November 30th, 2022, and state whether your talk will be virtual or in-person.

Where/When: Association of American Geographers Annual Meeting, March 23 – March 27, 2023, Denver. Additional information regarding the conference could be found at: https://www.aag.org/events/aag2023/

PhD Candidate Huan Ning receives the prestigious 2023 Breakthrough Graduate Scholar Award from USC!

Huan Ning, our PhD candidate, is selected to receive one of the 14 Breakthrough Graduate Scholar awards across the entire USC system. Big congratulations, Huan!

https://www.sc.edu/about/offices_and_divisions/research/news_and_pubs/news/2023/2023_Breakthrough_Awards_Announcement.php

“Each year, the Office of the Vice President for Research receives a large number of nominations for each of the Breakthrough awards, and a committee of faculty reviewers selects award recipients from the many remarkable faculty and graduate student nominees representing the entire USC system. The close competition embodies the spirit of strong, high-level research conducted here at the university. This year, we are very pleased to present two Breakthrough Leadership in Research awards, 12 Breakthrough Star awards and 14 Breakthrough Graduate Scholar awards to our 2023 class of Breakthrough awardees.

Vice President for Research Julius Fridriksson praised this notable group, saying, ‘As the research enterprise continues to grow at USC so does the quality of our researchers. This year’s awardees are a true testament to the accomplishments and quality of mentorship, research and the next generation of researchers here at USC. It’s an honor to be a considered a colleague of among the 2023 Breakthrough Awardees.‘ ”

GIBD members delivered presentations at the 2023 National Big Data Health Science Conference

GIBD members delivered presentations at the 4th Annual National Big Data Health Science Conference taken place at Columbia, South Carolina.

Cuizhen Wang, Drones for 3D Monitoring of Coastal Ecosystem Healthiness with Sea Level Rise

Zhenlong Li, Using Social Meda and Place Visitation Data for Public Health Research: Applications, Challenges, and Innovation Opportunities

Fengrui Jing, Disparities in mental health service utilization among immigrants in the U.S. using geospatial big data

Huan Ning, Using Smartphone-Based Place Visitation Big Data to Improve Health Measure Estimation

Dr. Fahui Wang will deliver a keynote presentation titled “Four Methodological Themes in Spatial Health Science” at the 2023 National Big Data Health Science Conference

Dr. Fahui Wang, Cyril & Tutta Vetter Alumni Professor, Associate Dean, the Graduate School, Department of Geography and Anthropology, Louisiana State University, will deliver a keynote presentation titled “Four Methodological Themes in Spatial Health Science” at the 2023 National Big Data Health Science Conference on Feb. 11, 11:15 am – 12:00 pm.

This talk outlines four methodological themes in spatial analytics with broad applications in public health, all grouped under the umbrella of “Spatial Health Science”. Spatial accessibility measures the relative ease by which the locations of health services can be reached, and serves as a major matric for location advantages. Regionalization constructs regions by merging small areas that are similar in attributes or are tightly connected. The former forms homogenous regions and the latter defines functional regions. Both can be scale flexible and thus produce a series of area units to support analysis, management, and planning. Spatial simulation imitates real-world social, economic, and human environments, behaviors and interactions in a lab setting, and empowers social scientists for discovery and cost-effective policy experiments. Finally, the maximal accessibility equality problem (MAEP) is proposed as a new location-allocation paradigm in spatial optimization to plan public resources and services.

More about Dr. Wang’s research: https://faculty.lsu.edu/fahui/index.php 

More information about the conference: https://www.sc-bdhs-conference.org/program-2023/

Dr. Zhenlong Li received funding from the Social, Behavioral, & Economic COVID Coordinating Center at the University of Michigan to examine COVID-19 impact on obesity-related behaviors

Dr. Zhenlong Li received a new grant from the Social, Behavioral, & Economic COVID Coordinating Center (SBE CCC) at the University of Michigan to investigate the geographic and racial disparities of COVID-19 impact on obesity-related behaviors using cellphone-based place visitation data. The project team also includes Drs. Andrew T Kaczynski, Shan Qiao, Bankole Olatosi, Jiajia Zhang, and Xiaoming Li from Arnold School of Public Health.

Project overview: Obesity is a predictor of multiple negative health outcomes, including type 2 diabetes, coronary heart disease, hypertension, various cancers, and premature death. In addition, obesity significantly affects quality of life and is bidirectionally associated with many mental illnesses including mood and anxiety disorders. Today, nearly two-thirds of US adults are overweight or obese, and one out of three is obese or morbidly obese. Examining the changes of obesity-related behaviors across different stages of the COVID-19 pandemic across changes by race/ethnicity and geolocation is important to better understand the impact of the pandemic on the obesity epidemic in the US. This study will investigate the changes of obesity-related behaviors during the pandemic using cellphone-based place visitation data for the entire US with the two specific aims: Aim 1: Quantify the visitation changes to the places that are relevant to obesity-related behaviors (i.e., physical activity, healthy and less healthy food choices) during the early-stage (2020) and later-stage (2021) of the pandemic at the Census tract level across US. The places include restaurants, fitness centers, recreation parks, and grocery stores identified using the North American Industry Classification System. Aim 2: Analyze the geographic disparities of the visitation changes derived in Aim 1 by examining the spatial distribution of the changes across US. Analyze the racial disparities of the changes using multivariate regression by integrating demographic and social determinants of health factors. Findings of this study will inform evidence-based policy making and strategies for reducing obesity disparities in terms of resource allocation and prevention interventions efforts in the context of the pandemic.

In collaboration with Big Data Health Science Center, GIBD releases the cellphone-based population flow data and Twitter data for USC researchers

The two datasets (cellphone-based population flow data and Twitter data) are among the four research datasets released by the USC Big Data Health Science Center as part of the Research Data Repositories (RDR) initiative.

Check out the Twitter data description at https://bigdata.sc.edu/twitter-data/

Check out the cellphone-based population flow (ODT flow) data description at https://bigdata.sc.edu/cell-phone-based-place-visitation-data/

News release: https://bigdata.sc.edu/bdhsc-rdr-announcement/

Registration for the 4th Annual National Big Data Health Science Conference at Columbia, South Carolina is now open!

Registration for the 4th Annual National Big Data Health Science Conference is now open! Check out conference website for more information about the 2-day conference agenda, our fantastic lineup of keynote speakers, and other details at SC Big Data Health Science Center Conference 2023 | (sc-bdhs-conference.org). 

The National Big Data Health Science Conference is a signature annual event of the Big Data Health Science Center (BDHSC). This 4th annual conference will include innovative plenary sessions, panels, and workshops that emphasize the role of interdisciplinary collaboration in Big Data applications and advancements in the health sciences.

The USC BDHSC was funded by the USC Excellence Initiative in 2019. Its goals are to leverage the existing expertise and resources in Big Data science and healthcare research, promote the utilization of Big Data analytics in healthcare research, train the next generation of investigators and students, especially those of diverse backgrounds, in data science for health-related research, and services improvement, and establish a sustainable academic-community partnership in improving the health outcomes in SC and beyond. The BDHSC has five strategic objectives including infrastructural and capacity development; professional development; community/industry engagement; academic training; and methodological advancement.

BDHSC consists of 5 content cores (Electronic Health Records, Genomics, Artificial Intelligence for Sensing and Diagnosis, Geospatial, and Social Media) and 2 functional hubs (Business/Entrepreneurship and Technology). It has assembled a multi-college, multi-disciplinary group of 50 faculty that conduct cutting cutting-edge research and discovery, offer professional development and academic training, and provide service to the community and industry.

Alexander Fulham successfully defended his thesis proposal “Sentiment analysis of Swedish and Finnish Twitter users’ views toward NATO pre- and post- 2022 Russian reinvasion of Ukraine”

Alexander Fulham successfully defended his thesis proposal next Tuesday, Dec. 20 at 12:30 PM in Callcott 228. His proposal title is “Sentiment analysis of Swedish and Finnish Twitter users’ views toward NATO pre- and post- 2022 Russian reinvasion of Ukraine“. His committee includes Drs. Zhenlong Li, Carl Dahlman, and Robert Kopack. Congratulations, Alex!

Two manuscripts, led by our postdoc researcher Dr. Fengrui Jing, have been accepted/published in top-tier international journals.

The article titled “Investigating the relationships between concentrated disadvantage, place connectivity, and COVID-19 fatality in the United States over time” is published in BMC Public Health.

Jing F., Li Z., Qiao S., Zhang J., Olatosi B., Li X., (2022), Investigating the relationships between concentrated disadvantage, place connectivity, and COVID-19 fatality in the United States over timeBMC Public Health. https://doi.org/10.1186/s12889-022-14779-1

Another article ” Using geospatial social media data for infectious disease studies: a systematic review” is accepted for publication in the International Journal of Digital Earth.

Jing F., Li Z., Qiao S., Zhang J., Olatosi B., Li X., (2022), Using geospatial social media data for infectious disease studies: a systematic review, International Journal of Digital Earth. (in press)

Congratulations to Fengrui and the team!

The Big Data Health Science Center is seeking research and program-based abstracts for oral and poster presentations responsive to its 4th annual conference

The Big Data Health Science Center is seeking research and program-based abstracts for oral and poster presentations responsive to its 4th annual conference theme, “Unlocking the Power of Big Data in Health: Translating Data Science into Program Development and Implementation.” This conference will be held in-person at the Pastides Alumni Center in Columbia, SC on February 10-11, 2023Accepted abstracts will be published in conference proceedings.

Research and program-based abstracts in the areas of infectious diseases, other health conditions, artificial intelligence methods for sensing and diagnosis, electronic health records, social media research, genomics analysis, geospatial sciences, infrastructural and capacity development, professional development, community/industry engagement, academic training, and methodological advances are desired.

Learn more about abstract submissions and current 2023 keynote speakers at www.sc-bdhs-conference.org

We’re still accepting papers for the Uncertainties in Big Data Analytics in Disaster Research session in AAG 2023

We’re still accepting papers for the Uncertainties in Big Data Analytics in Disaster Research session. Please consider being part of our awesome session that we have been organizing for 4 years now.

In this session, we will bring together researchers, practitioners, and policy makers from different specialties, institutions, sectors, and continents to share ideas, findings, methodologies, and technologies that are needed to leverage geospatial big data in disaster research as well as address the uncertainties to increase usability and acceptability of these datasets. The session will also provide a platform to establish and strengthen personal connections, communication channels, and research collaborations.

Significant advancements have been made to collect and analyze big datasets for emergency response, risk communication, mobility studies among others. These datasets tend to suffer from a myriad of uncertainties in terms of positional accuracy, context ambiguity, credibility, reliability, representativeness and completeness. Moreover, there are also serious concerns about data provenance and privacy. While there is no shortage in big data applications, the quality issue of these data remains an intellectual and practical challenge. Although aggregation, permutation or masking techniques can be used to protect data privacy without compromising the overall quality of data, its effectiveness depends on the degree of distribution heterogeneity of the geographic phenomenon.

Possible topics may include but are not limited to:

  • Quality issues in social media big data
  • Challenges in collecting, processing and analyzing big data for real-time applications
  • Big data quality and its impact in decision making
  • Calibration and validation techniques/approaches in big data
  • Data fusion of multi-source and/or heterogeneous datasets
  • Big data analytics in hazards and built-environment
  • Big data analytics in human movements and behaviors during disasters
  • Geo-visualization techniques to analyze and visualize social media data
  • Privacy and big data management
  • Provenance and metadata generation
  • Applications of machine-learning and computer vision in disaster research
  • New methods to measure social media credibility of social media content and users
  • Influential social media user detection

Organizers

If interested in participating in this session, please send the confirmation of a successful abstract submission to us by December 1st, 2022, and state whether your talk will be virtual or in-person.

Abstract submission portal: aag.secure-platform.com/aag2023

New Article: Exploring large-scale spatial distribution of fear of crime by integrating small sample surveys and massive street view images

Check out our new article titled “Exploring large-scale spatial distribution of fear of crime by integrating small sample surveys and massive street view images“, published in Environment and Planning B Urban Analytics and City Science.

Abstract: A tremendous amount of research use questionnaires to obtain individuals’ fear of crime and aggregate it to the neighborhood level to measure the spatial distribution of fear of crime. However, the cost of using questionnaires to measure the large-scale spatial distribution of fear of crime is high. The built environment is known to influence people’s perceptions, including fear of crime. This study develops a machine learning model to link built environment extracted from street view images to fear of crime obtained from questionnaires, and then applies this model to extrapolate fear of crime for neighborhoods without the questionnaires. Using massive street view images and a survey among 1,741 residents in 80 neighborhoods in Guangzhou, China, this study developed a novel systematic approach to measuring large-scale spatial fear of crime at the neighborhood level for 1,753 neighborhoods. This is the first study to measure fear of crime at the neighborhood level for a metropolitan area of nearly 20 million people. The integration of survey data and street view images provides an opportunity to develop a more effective way to measure the spatial distribution of fear of crime. This approach could be applied to map other types of perceptions at a spatial resolution of the neighborhood level.
The National Big Data Health Science Conference 2023 will take place from February 10-11 in Columbia

The National Big Data Health Science Conference 2023, organized by UofSC Big Data Health Science Center (BDHSC),  will take place from February 10-11 at Pastides Alumni Center, Columbia, South Carolina. This year’s theme is “Translating Data Science into Program Development and Implementation”. Stay tuned with us!

Read more at https://www.sc-bdhs-conference.org/

Diverged landscape of restaurant recovery: the effect of COVID-19 on the restaurant industry in the United States

The COVID-19 pandemic has imposed catastrophic impacts on the restaurant industry as a crucial socioeconomic sector that contributes immensely to the global economy. However, what remains incomplete is our quantitative understanding of how the restaurant industry was recovered from COVID-19 in terms of restaurant visitations and revenue, customers’ origins as well as the relationship between restaurant visitations and travel distances. Existing studies in the context of COVID-19 mainly reply on survey data and cannot reveal the changing spectrum of the restaurant industry at a large spatial and temporal scale. Here we construct a spatially explicit evaluation of the effect of COVID-19 on the restaurant industry in the United States, drawing on the attributes of +200,000 restaurants from Yelp and +600 million individual-level restaurant visitations provided by SafeGraph from 1 January 2019 to 31 December 2021. We produce quantitative evidence of lost restaurant visitations and revenue amid the COVID-19 pandemic, the changes in the areal characteristics of customers’ origins, and the retained visitation law of human mobility-the number of restaurant visitations decreases as the inverse square of their travel distances-though such a distance-decay effect varies across metropolitan areas and becomes marginal at the later stage of the pandemic. Our findings support policy makers to monitor economic relief and design place-based policies for economic recovery.

Read the full preprint article at:

https://www.researchgate.net/publication/363794683_Diverged_landscape_of_restaurant_recovery_the_effect_of_COVID-19_on_the_restaurant_industry_in_the_United_States

Check out our new study of using neighborhood- level simulation with human mobility data and SEIR model to reveal geographic transmission pattern of COVID-19

A new preprint article titled “Revealing geographic transmission pattern of COVID-19 using neighborhood- level simulation with human mobility data and SEIR model: A Case Study of South Carolina”, led by our student Huan Ning is now available on medRxiv.

Abstract: Direct human physical contact accelerates COVID-19 transmission. Smartphone mobility data has been an emerging data source to reveal fine-grained human mobility, which can be used to estimate the intensity of physical contact surrounding different locations. Our study applied smartphone mobility data to simulate the second wave spreading of COVID-19 in January 2021 in three major metropolitan statistical areas (Columbia, Greenville, and Charleston) in South Carolina, United States. Based on the simulation, the number of historical county-level COVID-19 cases was allocated to neighborhoods (Census blockgroups) and points of interest (POIs), and the transmission rate of each allocated place was estimated. The result reveals that the COVID-19 infections during the study period mainly occurred in neighborhoods (86%), and the number is approximately proportional to the neighborhood’s population. Restaurants and elementary and secondary schools contributed more COVID-19 infections than other POI categories. The simulation results for the coastal tourism Charleston area show high transmission rates in POIs related to travel and leisure activities. The results suggest that the neighborhood-level infectious controlling measures are critical in reducing COVID-19 infections. We also found that the households of lower socioeconomic status may be an umbrella against infection due to fewer visits to places such as malls and restaurants associated with their low financial status. Control measures should be tailored to different geographic locations since transmission rates and infection counts of POI categories vary among metropolitan areas.

Read full article here

Check out the news release about our recent publication about the COVID-19 impact on the black-owned restaurants

Check out the news release about our recent publication about the COVID-19 impact on the black-owned restaurants, led by Dr. Xiao Huang, our lab alumnus and now the Assistant Professor at the Department of Geosciences, University of Arkansas.

https://www.eurekalert.org/news-releases/963549

Full article: https://www.researchgate.net/publication/361780077_Black_businesses_matter_A_longitudinal_study_of_black-owned_restaurants_in_the_COVID-19_pandemic_using_geospatial_big_data

New review article: Social media mining under the COVID-19 context – Progress, challenges, and opportunities

Our new collaborative review article titled “Social media mining under the COVID-19 context: Progress, challenges, and opportunities” is published in the Special Issue “Harnessing Geospatial Big Data for Infectious Diseases” in the International Journal of Applied Earth Observation and Geoinformation.

Abstract: Social media platforms allow users worldwide to create and share information, forging vast sensing networks that allow information on certain topics to be collected, stored, mined, and analyzed in a rapid manner. During the COVID-19 pandemic, extensive social media mining efforts have been undertaken to tackle COVID-19 challenges from various perspectives. This review summarizes the progress of social media data mining studies in the COVID-19 contexts and categorizes them into six major domains, including early warning and detection, human mobility monitoring, communication and information conveying, public attitudes and emotions, infodemic and misinformation, and hatred and violence. We further document essential features of publicly available COVID-19 related social media data archives that will benefit research communities in conducting replicable and reproducible studies. In addition, we discuss seven challenges in social media analytics associated with their potential impacts on derived COVID-19 findings, followed by our visions for the possible paths forward in regard to social media-based COVID-19 investigations. This review serves as a valuable reference that recaps social media mining efforts in COVID-19 related studies and provides future directions along which the information harnessed from social media can be used to address public health emergencies.

GIBD receives new funding to develop a network-based big data approach to measure healthcare utilization disparity

GIBD receives $30,000 from the USC BDHSC Pilot Project Program to conduct a pilot study of developing a novel network-based big data approach to measure healthcare utilization disparity. The project team include Drs. Zhenlong Li, Shan Qiao, Bankole Olatosi, and Jiajia Zhang.

Project summary: Healthcare utilization is a critical factor that influences population health and wellbeing. To identify, explain, and address disparities and inequities in healthcare utilization, it is necessary to develop a valid measurement approach that can accurately capture the disparities and explore the factors that contribute to the disparities in a timely manner. Increasing attention is being paid to developing constructs or measurement approaches that can reflect complex interplays of factors at multiple socioecological levels. The availability of healthcare Big Data (e.g., large place visitation data sampled from mobile devices and electronic health records [EHR]) and advanced Big Data analytics makes it possible to use Big Data approaches to address existing knowledge gaps in measurement methodology including a lack of real-world evidence, limited availability of real-time and large-coverage datasets, and a dearth of studies applying multilevel perspectives. In this pilot project, we propose to develop a network-based big data approach to measure and visualize disparities in healthcare utilization in South Carolina (SC). Specifically, we will first develop a machine learning-based network prediction model to construct a statewide healthcare visitation network using cellphone-based place visitation data and ground-truth EHR data (for model training and refining); based on the validated statewide healthcare visitation network, we will detect actual catchment areas of healthcare facilities and develop healthcare utilization measures (indices) using geographically constrained network partition and aggregation. We will then test the performance and utility of the network-based big data approach in revealing healthcare utilization patterns using multivariate geo-visualization. Leveraging our fruitful collaboration with the state’s health department and health agencies and successful experiences with implementing NIH-funded Big Data studies since 2017, we will be able to develop this network-based big data approach for analyzing healthcare utilization disparity, which, with proven efficacy, will contribute to the paradigm shift from sampling-based study to population-based real-world study and the examination of interplays between factors at various socioecological levels.

Our new preprint article “An optimal sensors-based simulation method for spatiotemporal event detection” is made to the public
Abstract: Human movements in urban areas are essential for understanding the human-environment interactions. However, activities and associated movements are full of uncertainties due to the complexity of a city. In this paper, we propose an optimal sensors-based simulation method for spatiotemporal event detection using human activity signals derived from taxi trip data. A sensor here is an abstract concept such that only the true observation data at the sensor location will be treated as known data for the simulation. Specifically, we first identify the optimal number of sensors and their locations that have the strongest correlation with the whole dataset. The observation data points from these sensors are then used to simulate a regular, uneventful scenario using the Discrete Empirical Interpolation Method. By comparing the simulated and observation scenarios, events are extracted both spatially and temporally. We apply this method in New York City with taxi trip records data. Results show that this method is effective in detecting when and where events occur.
Black businesses matter: A longitudinal study of black-owned restaurants in the COVID-19 pandemic using geospatial big data

Check out our new article titled “Black businesses matter: A longitudinal study of black-owned restaurants in the COVID-19 pandemic using geospatial big data
” published in Annals of the American Association of Geographers .

Abstract: Black communities in the U.S. have been disproportionately affected by the COVID-19 pandemic; however, few empirical studies have been conducted to examine the conditions of Black-owned businesses in the U.S. during this challenging time. In this paper, we assess the circumstances of Black-owned restaurants during the entire year of 2020 through a longitudinal quantitative analysis of restaurant patronage. Using multiple sources of geospatial big data, the analysis reveals that most Black-owned restaurants in this study are disproportionately impacted by the COVID-19 pandemic among different cities in the U.S. over time. The finding reveals the need for a more in-depth understanding of Black-owned restaurants’ situations during the pandemic and further indicates the significance to carry out place-based relief strategies. Our findings also urge big tech companies to improve existing Black-owned business campaigns to enable sustainable support. As the first to systematically examine the racialization of locational information, this paper implies that GIS development should not be detached from human experience, especially that of minorities. A humanistic rewiring of GIS is envisioned to achieve a more racially equitable world.
New preprint: Does place connectivity moderate the association between concentrated disadvantage and COVID-19 fatality in the United States?

Access the full article here. 

Abstract: Concentrated disadvantaged areas have been disproportionately affected by COVID-19 outbreak in the United States (US). Meanwhile, highly connected areas may contribute to higher human movement, leading to higher COVID-19 cases and deaths. This study examined whether place connectivity moderated the association between concentrated disadvantage and COVID-19 fatality. Using COVID-19 fatality over four time periods, we performed mixed-effect negative binomial regressions to examine the association between concentrated disadvantage, Twitter-based place connectivity, and county-level COVID-19 fatality, considering potential state-level variations. Results revealed that concentrated disadvantage was significantly associated with an increased COVID-19 fatality. More importantly, moderation analysis suggested that place connectivity significantly exacerbated the harmful effect of concentrated disadvantage on COVID-19 fatality, and this significant moderation effect increased over time. In response to COVID-19 and other future infectious disease outbreaks, policymakers are encouraged to focus on the disadvantaged areas that are highly connected to provide additional pharmacological and non-pharmacological intervention policies.

Yuqin Jiang successfully defended her dissertation “Quantifying Human Mobility Patterns During Disruptive Events with Big Data”

GIBD lab member Yuqin Jiang successfully defended her dissertation titled “Quantifying Human Mobility Patterns During Disruptive Events with Big Data” on May 18, 2022.  Big thanks to her committee, Professors Susan Cutter, Michael Hodgson, and Qunying Huang (University of Wisconsin-Madison).

Yuqin has accepted an offer to join Texas A&M University as a Postdoctoral Researcher in July 2022 to start her academic career!

Congratulations, Yuqin!

Two articles published in the Canadian Journal of Remote Sensing investigating the usage of deep learning for environmental issues

Learning-Based Methods for Detection and Monitoring of Shallow Flood-Affected Areas: Impact of Shallow-Flood Spreading on Vegetation Density

This study aims to investigate the impacts of shallow flood spreading on vegetation density using a time-series collection of Landsat images spanning 2012–2020. To do this, Support Vector Machine (SVM), Random Forest (RF), Classification and Regression tree (CART) and Deep Learning Convolutional Neural Network (DL-CNN) algorithms were employed for flood-affected areas mapping and monitoring. The models were trained by using 214, 235, 230, and 219 ground truth data for years 2012, 2014, 2017 and 2020 respectively. Our accuracy assessment via the area under curve (AUC) method reveals that the DL-CNN outperforms the SVM, the RF and the CART models for detecting and mapping shallow-flood-affected areas. The findings of this study further revealed significant changes in the NDVI values within a period before and after flood occurrence. While the mean values of the NDVI were estimated 0.232, 0.221, 0.213, and 0.232 for years 2012, 2014, 2017, and 2020, respectively, prior to flood spreading, these values increased up to 0.464, 0.476, 0.355 and 0.444, respectively following flood occurrence. Furthermore, physical-chemical soil properties (e.g., clay, EC, Na, and MgHCO3), have grown considerably in the study region following the flood spreading.

Kazemi Garajeh, M., Weng, Q., Hossein Haghi, V., Li, Z., Kazemi Garajeh, A., & Salmani, B. (2022). Learning-Based Methods for Detection and Monitoring of Shallow Flood-Affected Areas: Impact of Shallow-Flood Spreading on Vegetation DensityCanadian Journal of Remote Sensing, 1-23.

A Comparison between Sentinel-2 and Landsat 8 OLI Satellite Images for Soil Salinity Distribution Mapping Using a Deep Learning Convolutional Neural Network

In this paper, we aim to compare the suitability of Sentinel-2 and Landsat 8 OLI images for detecting and mapping soil salinity distribution (SSD) using a deep learning convolutional neural network (DL-CNN) approach. We first identified and selected six SSD predisposing variables to train the models. These variables are the normalized difference vegetation index (NDVI), land use, soil types, geomorphology, land surface temperature, and evaporation rate. Next, we collected 219 ground control points from the top 20 cm of the soil surface and randomly divided them into training (70%) and validation (30%) datasets. We then evaluated the different activation, loss/cost, and optimization functions and, finally, employed ReLu, Cross-Entropy, and Adam as the most effective activation function, loss/cost function, and optimizer, respectively. The results showed that the Sentinel-2 image (94.78% overall accuracy and a Kappa of 93.14%) is more suitable for detecting and mapping SSD than the Landsat 8 OLI image (91.45% overall accuracy and a Kappa of 90.45%). Our findings also demonstrated that the DL-CNN approach can support fast and reliable image analysis and classification. As such, this research is a promising step toward understanding, controlling, and managing the complex mechanisms of soil salinization.

Kazemi Garajeh, M., Blaschke, T., Hossein Haghi, V., Weng, Q., Valizadeh Kamran, K., & Li, Z. (2022). A Comparison between Sentinel-2 and Landsat 8 OLI Satellite Images for Soil Salinity Distribution Mapping Using a Deep Learning Convolutional Neural NetworkCanadian Journal of Remote Sensing, 1-17.
Huan Ning successfully defended his dissertation proposal “Neighborhood Mobility Assessment for Wheelchair Users Based on Street View Imagery and Deep Learning”

GIBD lab member Huan Ning successfully defended his dissertation proposal “Neighborhood Mobility Assessment for Wheelchair Users Based on Street View Imagery and Deep Learning” on April 20, 2022.  Huan’s dissertation committee consists of Professors Zhenlong Li (Chair),  Susan Wang, Michael Hodgson, Shan Qiao (Arnold School of Public Health).

Congratulations, Huan!

New article accepted by CEUS: Converting street view images to land cover maps for metric mapping: a case study on sidewalk network extraction for the wheelchair users

Our new article titled “Converting street view images to land cover maps for metric mapping: a case study on sidewalk network extraction for the wheelchair users”, led by GIBD member Huan Ning is accepted for publication by Computers, Environment and Urban Systems (acceptance rate: 12%, Impact Factor: 5.3).

Abstract: Street view images are now widely used in web map services, providing on-site photos of street scenes for users to explore without physically being in the field. These photos record detailed visual information of the street environment with geospatial control; therefore, they can be used for metric mapping purposes. In this study, we present a method to convert street view images to measurable land cover maps using their associated depthmap data. The proposed method can autonomously extract and measure land cover objects over large areas covered by a mosaic of street view images. In the case study, we demonstrated the use of land cover maps derived from Google Street View images to extract sidewalk features and to measure sidewalk clear widths for wheelchair users. Sidewalk feature slopes were also extracted from the metadata of street view images. Using the Washington D.C., U.S. as the study area, our method extracted a sidewalk network of 2,561 km in length with the precision of 0.8662 and recall of 0.8525. The extracted sidewalks have widths between 1 – 2 m, the mean width error of 0.24 m, and the slope mean error of 0.638°. In Washington D.C., most sidewalks meet the minimum width requirement (0.9 m), but 20% of them have slopes that exceed the maximum allowance (1:20 or about 2.9°). These results demonstrate the converted land cover maps from street view images can be used for metric mapping purposes. The extracted sidewalk network can serve as a valuable inventory for urban planners to promote equitable walkability for mobility disabled users. And if widely available, mobility-impaired users could consult them prior to planning a route.

Yuqin Jiang will join the Civil Engineering Department at the Texas A&M University as a Postdoctoral Researcher in July 2022

GIBD lab member Yuqin Jiang has accepted an academic job offer to join the Civil Engineering Department at the Texas A&M University as Postdoctoral Researcher in July 2022.  Yuqin will defend his dissertation proposal titled “Quantifying Human Mobility Patterns During Disruptive Events with Big Human Mobility Data” in May. Congratulations, Yuqin!

Call for Papers on Special Issue: “Harnessing Geospatial Big Data for Infectious Diseases” in the International Journal of Applied Earth Observation and Geoinformation (Elsevier)

We are launching a new Special Issue “Harnessing Geospatial Big Data for Infectious Diseases” in the International Journal of Applied Earth Observation and Geoinformation (Elsevier) (Impact factor of 5.933).

https://www.journals.elsevier.com/international-journal-of-applied-earth-observation-and-geoinformation/call-for-papers/call-for-papers-on-special-issue-harnessing-geospatial-big-data-for-infectious-diseases 

Guest Editors:

Dr. Zhenlong Li, University of South Carolina, USA

Dr. Shengjie Lai, University of Southampton, UK

Dr. Kathleen Stewart, University of Maryland, USA

Dr. Bo Huang, Chinese University of Hong Kong, China

Dr. Xiaoming Li, University of South Carolina, USA


Submission deadline: December 31, 2022

Planned publication date: Spring 2023

Aims and Scope:

Public health is inextricably linked to geospatial context. Where, when, and how people interact with natural, social, built, economic and cultural environments directly influences human health outcomes, policy making, planning and implementation, especially for infectious diseases such as COVID-19, HIV, and influenza. Geospatial data has long been used in health studies, dating back to John Snows’ groundbreaking mapping of cholera outbreaks in London, and continuing today in a wide range of scientific inquiries, e.g., examining the effects of environmental, neighborhood, and demographic factors on health outcomes, understanding accessibility and utilization of health services, modeling the spread of infectious diseases, assessing the effectiveness of disease interventions, and developing better healthcare strategies to improve health outcomes and equity.

Emerging sources of geospatial big data, such as data collected from social sensing, remote sensing, and health sensing (health wearables) contain rich information about the environmental, social, population, and individual factors for health that are not available in traditional health data and population statistics. Along with innovative spatial and computing methodologies in GIScience, geospatial big data provides unprecedented opportunities for advancing the infecious disease research. The ongoing COVID-19 pandemic further highlights the demand on and the power of big data and spatial analysis in modeling, simulating, mapping, and predicting the spread of infectious diseases and their intervention across the world.

Along these lines, this special issue on “Harnessing Geospatial Big Data for Infectious Diseases” by the International Journal of Applied Earth Observation and Geoinformation aims to capture recent advancements in leveraging geospatial big data and spatial analysis in infectious disease-related research, such as disease mapping and cluster detection, early detection and warning of disease outbreaks, and spatial analysis and modeling of disease spread and control. We solicit original, unpublished research articles that shed light on the opportunities, challenges and solutions involving the use of geospatial big data for advancing infectious diseases research.

Potential topics include (but are not limited to) the following:

  • Collection, processing, and integration of geospatial big data (e.g., satellite images, floor plans, 3D models, social media and mobile phone data) with health big data (e.g., electronic medical records) to extract geospatial context at various spatiotemporal scales (e.g., environmental risks, socioeconomic factors,and population mobility) to address infectious disease questions.
  • Innovative methodologies for geospatial big data analytics in the context of infectious diseases, including geocomputation algorithms and geostatistical models. For example, assessing the effectiveness of non-pharmaceutical interventions in preventing the resurgence of COVID-19 using human mobility data.
  • Combining geospatial big data with advanced computing technologies such as machine learning (ML) and geospatial artificial intelligence (GeoAI) to uncover hidden patterns and new information in infectious diseases related to, for example, the spreading, disparity, morbidity, and mortality of COVID-19.
  • Developing accessible and resuable geovisualization and mapping methods, sharable data products, and online tools that help foster multidiscriplinary collaborations, engage community and facilitate public understanding and decision making during disease outbreaks such as the COIVD-19 pandemic.

Submission of manuscripts

Authors can submit manuscripts for the Special Issue using Editorial Manger®, the online submission system for the International Journal of Applied Earth Observation and Geoinformation. Please select ‘VSI:BigData&InfectiousDisease’ as the article type. Submitted manuscripts will be peer-reviewed according to the guidelines, available on the website, of the journal. Please note that articles will be published separately, in different volumes, after they are accepted, and will be grouped together online as a Special Issue. Submit your manuscript to https://www.editorialmanager.com/JAG/ by March 31, 2021.

JAG is an open access journal with an impact factor of 5.933. The special issue will include a maximum of 12 papers. We look forward to your contributions. Please do not hesitate to contact the Guest Editors in case of questions.

GIBD lab receives funding from South Carolina Sea Grant Consortium to develop a GIS-based siting tool for South Carolina mariculture site selection

GIBD members receive $34,993 in funding from South Carolina Sea Grant Consortium to develop a GIS-based siting tool for South Carolina mariculture site selection. The project team includes Dr. Zhenlong Li (PI), Dr. Cuizhen Wang (Co-PI), and Huan Ning.

The shellfish industry in coastal South Carolina (SC) weighs heavily in culturing and harvesting eastern oyster (Crassostrea virginica) and hard clam (Mercenaria spp.) in tidal creeks and estuaries. Oyster farming in SC is relatively new and is in a smaller scale than those well-established mariculture industries in other Atlantic and Gulf coastal states. However, its economic and public benefits deserve to be recognized. The total oysters farmed in SC has boomed from 139,178 in 2014 to over 1.3 million in 2020 [1]. As filter feeders, these oysters could produce 10 billion gallons of clean water as estimated by SC Department of Natural Resources (SCDNR).

To address the critical need of shellfish siting solutions in South Carolina, this project aims to develop an online GIS-based tool to facilitate the process of selecting an appropriate location for shellfish mariculture lease. The tool will be used by current shellfish growers and potential new growers to successfully locate usable, environmentally and economically beneficial sites as they work through the regulatory process. The longer-term vision of the proposed work is to extend this tool as a sustainable GIS-based mariculture decision-making system that is able to intelligently integrate the multiple siting factors and consider the ever-changing environment with advanced technologies (e.g., spatiotemporal modeling and artificial intelligence) to bolster the healthy and sustainable growth of the South Carolina shellfish aquaculture industry.

New article “Human mobility and COVID-19 transmission: a systematic review and future directions” is published in the Annuals of GIS

The article is open access available at: https://www.tandfonline.com/doi/full/10.1080/19475683.2022.2041725 

Zhang, M., Wang, S., Hu, T., Fu, X., Wang, X., Hu, Y., Halloran B., Li Z. … & Bao, S. (2022). Human mobility and COVID-19 transmission: A systematic review and future directions. Annals of GIS, 1-14.

Abstract: Without a widely distributed vaccine, controlling human mobility has been identified and promoted as the primary strategy to mitigate the transmission of COVID-19. Many studies have reported the relationship between human mobility and COVID-19 transmission by utilizing the spatial-temporal information of mobility data from various sources. To better understand the role of human mobility in the pandemic, we conducted a systematic review of articles that measure the relationship between human mobility and COVID-19 in terms of their data sources, mathematical models, and key findings. Following the guidelines of the Preferred Reporting Items for Systematic Reviews and Meta-Analyses (PRISMA) statement, we selected 47 articles from the Web of Science Core Collection up to September 2020. Restricting human mobility reduced the transmission of COVID-19, although the effectiveness and stringency of policy implementation vary temporally and spatially across different stages of the pandemic. We call for prompt and sustainable measures to control the pandemic. We also recommend researchers 1) to enhance multi-disciplinary collaboration; 2) to adjust the implementation and stringency of mobility-control policies in corresponding to the rapid change of the pandemic; 3) to improve mathematical models used in analysing, simulating, and predicting the transmission of the disease; and 4) to enrich the source of mobility data to ensure data accuracy and suability.


GIBD members co-organized 5 sessions and delivered a number of presentations at the 2022 AAG Annual Meeting

GIBD lab members have co-organized 5 sessions and will deliver 6 presentations in 2022 AAG related to geospatial big data, human mobility, and public health. See more information below.


Sessions organized

Harnessing Geospatial Big Data for Infectious Diseases

Type: Virtual Paper

Day: 2/26/2022
Start Time: 9:40 AM
End Time: 11:00 AM

Organizer(s): Zhenlong Li , Shengjie Lai, Bo Huang, Kathleen Stewart

Chairs(s): Zhenlong Li, University of South Carolina

https://aag-annualmeeting.secure-platform.com/a/solicitations/19/sessiongallery/2952


Symposium on Human Dynamics Research: Human mobility in Big Data Era I

Type: Virtual Paper

Day: 2/27/2022
Start Time: 3:40 PM
End Time: 5:00 PM

Organizer(s): Yuqin Jiang, Zhenlong Li , Xiao Huang

Chairs(s): Yuqin Jiang, University of South Carolina

https://aag-annualmeeting.secure-platform.com/a/solicitations/19/sessiongallery/2707


Symposium on Human Dynamics Research: Human mobility in Big Data Era II

Type: Virtual Paper

Day: 2/27/2022
Start Time: 5:20 PM
End Time: 6:40 PM

Organizer(s): Yuqin Jiang, Zhenlong Li , Xiao Huang

Chairs(s): Yuqin Jiang, University of South Carolina

https://aag-annualmeeting.secure-platform.com/a/solicitations/19/sessiongallery/3093


Uncertainties in Big Data Analytics in Disaster Research

Type: Virtual Paper

Day: 2/27/2022
Start Time: 11:20 AM
End Time: 12:40 PM

Organizer(s): Edwin Chow, Zhenlong Li, Qunying Huang

Chairs(s): Bandana Kar, Oak Ridge National Laboratory

https://aag-annualmeeting.secure-platform.com/a/solicitations/19/sessiongallery/2919


Urban Computational Paradigms with Shareable Data, Models, Tools, and Frameworks

Type: Virtual Paper

Day: 2/26/2022
Start Time: 3:40 PM
End Time: 5:00 PM

Organizer(s): Xiao Huang, Xinyue Ye, Zhenlong Li

Chairs(s): Xiao Huang, University of Arkansas

https://aag-annualmeeting.secure-platform.com/a/solicitations/19/sessiongallery/2656


Presentations

AAG 2022 Symposium on Data-Intensive Geospatial Understanding in the Era of AI and CyberGIS: CyberGIS-enabled spatial epidemiology

Type: Virtual Panel

Day: 2/27/2022
Start Time: 3:40 PM
End Time: 5:00 PM

Organizer(s): Rebecca Vandewalle

Chairs(s): Xun Shi, Dartmouth College

Panelist: Song Gao, Zhenlong Li, David Haynes, Estella Geraghty, Shaowen Wang

https://aag-annualmeeting.secure-platform.com/a/solicitations/19/sessiongallery/3391


Event detection method with principal component analysis based sensor placement

Session Type: Virtual Paper Abstract
Day: Saturday
Session Start / End Time: 2/26/2022 11:20 AM (Eastern Standard Time) – 2/26/2022 12:40 PM (Eastern Standard Time)
Room: Virtual 20

Authors: Yuqin Jiang, Andrey Popov, Zhenlong Li

https://aag-annualmeeting.secure-platform.com/a/solicitations/19/sessiongallery/3615


Converting street view images to land cover maps for metric mapping: a case study on sidewalk network extraction for the wheelchair users

Session Type: Virtual Paper Abstract
Day: Tuesday
Session Start / End Time: 3/1/2022 02:00 PM (Eastern Standard Time) – 3/1/2022 03:20 PM (Eastern Standard Time)
Room: Virtual 20

Authors: Huan Ning, Zhenlong Li,  Cuizhen Wang,  Michael E. Hodgson, Xiao Huan, Xiaoming Li

https://aag-annualmeeting.secure-platform.com/a/solicitations/19/sessiongallery/3094/application/12888


Spatiotemporal changes in visitation to U.S. national parks and associated social inequity: A big data approach

Session Type: Virtual Paper Abstract
Day: Monday
Session Start / End Time: 2/28/2022 03:40 PM (Eastern Standard Time) – 2/28/2022 05:00 PM (Eastern Standard Time)
Room: Virtual 7

Authors: Junyu Lu, Xiao Huang,  John A. Kupfer, Xiao Xiao,  Zhenlong Li, Hanxue Wei, Sicheng Wang, Liao Zhu

https://aag-annualmeeting.secure-platform.com/a/solicitations/19/sessiongallery/3101/application/10909


Measuring Human Mobility Dynamics and Place Connectivity Using Big Social Media Data

Session Type: Virtual Paper Abstract
Day: Saturday
Session Start / End Time: 2/26/2022 09:40 AM (Eastern Standard Time) – 2/26/2022 11:00 AM (Eastern Standard Time)
Room: Virtual 27

Authors: Zhenlong Li, University of South Carolina

https://aag-annualmeeting.secure-platform.com/a/solicitations/19/sessiongallery/2952/application/12549

The Big Data Health Science Center’s Geospatial Core announced the second annual Geographic Information Science (GIS) Scholars Program.
The Big Data Health Science Center’s Geospatial Core is pleased to announce the
second annual Geographic Information Science (GIS) Scholars Program. This program
is being launched to recognize and support three outstanding undergraduate or graduate
students who have demonstrated interest, potential, and/or experience in GIS and health
research. GIS and health research is broadly defined, and includes, but is not limited to,
using GIS to evaluate the social determinants of health, health behaviors, health
outcomes, access to health care and social services, utilization of health services,
environmental exposures, built environment, and other health-related factors through
mapping and spatial analysis. Anyone from the College of Arts & Sciences, Arnold School
of Public Health, or School of Medicine is welcome to apply. The goals of this program
are to:
1) Enhance students’ research and professional development in the area of GIS and
health research
2) Cultivate students’ interest in GIS and spatial applications to health research
3) Build the technical and writing skills of students to pursue scholarly publications
and reports
4) Develop scholars in health GIS who go on to make important contributions to the
academic, public health, and other related sectors

Two student scholars will be awarded $4,500 each, which can be used toward
professional development activities and expenses including resources and supplies for
data collection and analysis, travel and registration at national or international
conferences where research is presented on this topic, for professional workshops, or for
other continuing education/training opportunities of importance to GIS and health
research. Up to $3,000 can be requested for stipend and fringe for the applicant, with the
additional $1,500 budgeted to other non-salary related costs. These funds are not
expected to take the place of resources available through existing graduate research or
teaching assistantships but are rather intended as supplements.

Scholars will be expected to engage in research and professional development activities
with the Big Data Health Science Center during the award period as well as present
preliminary findings at one or more research events/conferences (e.g., Big Data Health
Science Center Seminar Series, Discover UofSC, and/or the James Clyburn Health
Disparities Lecture) and will be strongly encouraged to submit the full findings from their
study within a year. The award funds must be used within 9 months of receipt and all
expenses must be pre-approved by the Director of the BDHSC Geospatial Core. Each
scholar will have the ability to work with a mentor. Please include the mentor you would
like to work with in your application.

Check out our flyer for more information about the program:  Health GIS Scholars Program. 

Grayson Morgan passed his dissertation defense on February 9 titled “sUAS and Deep Learning for High-resolution Monitoring of Tidal Marshes in Coastal South Carolina”

GIBD lab member Grayson Morgan successfully defended his dissertation, “sUAS and Deep Learning for High-resolution Monitoring of Tidal Marshes in Coastal South Carolina”. His research committee includes Dr. Susan Wang (Chair), Dr. Michael Hodgson (co-Chair), Dr. Zhenlong Li, and Dr. Steve Schill from the Nature Conservancy.

Big congratulations to the soon-to-be Dr. Morgan!  Excellent job, Grayson!

Our new review paper “Human mobility and COVID-19 transmission: a systematic review and future directions” is accepted for publication by Annals of GIS.

Our new collaborative review paper titled “Human mobility and COVID-19 transmission: a systematic review and future directions” has been accepted for publication by the Annals of GIS.

Abstract:  Without a widely distributed vaccine, controlling human mobility has been identified and promoted as the primary strategy to mitigate the transmission of COVID-19. Many studies have reported the relationship between human mobility and COVID-19 transmission by utilizing the spatial-temporal information of mobility data from various sources. To better understand the role of human mobility in the pandemic, we conducted a systematic review of articles that measure the relationship between human mobility and COVID-19 in terms of their data sources, mathematical models, and key findings. Following the guidelines of the Preferred Reporting Items for Systematic Reviews and Meta-Analyses (PRISMA) statement, we selected 47 articles from Web of Science Core Collection up to September 2020. Restricting human mobility reduced the transmission of COVID-19 spatially, although the effectiveness and stringency of policy implementation vary temporally and spatially across different stages of the pandemic. We call for prompt and sustainable measures to control the pandemic. We also recommend researchers 1) to enhance multi-disciplinary collaboration; 2) to adjust the implementation and stringency of mobility-control policies in corresponding to the rapid change of the pandemic; 3) to improve mathematical models used in analyzing, simulating, and predicting the transmission of the disease; and 4) to enrich the source of mobility data to ensure data accuracy and suability.

Zhang M., Wang S., Hu T., Fu. X., Wang X., Hu Y., Halloran B., Cui Y., Liu H., Bao S., Li Z. (2022). Human mobility and COVID-19 transmission: a systematic review and future directions, Annals of GIS (in press)

Welcome to join the 3rd annual National Big Data Health Science Conference on February 11-12, 2022!

Welcome to join the 3rd annual National Big Data Health Science Conference on February 11-12, 2022 (virtual) organized by the UofSC Big Data Health Science Center. The theme of the conference this year is “Unlocking the Power of Big Data in Health: Developing an Interdisciplinary Response for Health Equity”. This conference will bring together leaders from academia, government, industry, and healthcare systems to focus on and forge new discussions about the role of interdisciplinary collaboration in Big Data applications and advancements in the health sciences.

Register here: https://lnkd.in/eXC_JYJc

The program agenda can be found here: https://www.sc-bdhs-conference.org/program-2022/

Article “Deep Learning of High-Resolution Aerial Imagery for Coastal Marsh Change Detection: A Comparative Study” accepted for publication in IJGI

Our new article titled “Deep Learning of High-Resolution Aerial Imagery for Coastal Marsh Change Detection: A Comparative Study“ is accepted for publication in the ISPRS International Journal of Geo-Information.

Abstract: Deep learning techniques are increasingly being recognized as effective image classifiers. Aside from their successful performance in past studies, the accuracies have varied in complex environments in comparison with the popularly applied machine learning classifiers. This study seeks to explore the feasibility for using a U-Net deep learning architecture to classify bi-temporal high resolution county scale aerial images to determine the spatial extent and changes of land cover classes that directly or indirectly impact tidal marsh. The image set used in the analysis is a collection of a 1-m resolution collection of National Agriculture Imagery Program (NAIP) tiles from 2009 and 2019 covering Beaufort County, South Carolina. The U-net CNN classification results were compared with two machine learning classifiers, the Random Trees (RT) and the Support Vector Machine (SVM). The results revealed a significant accuracy advantage in using the U-Net classifier (92.4%) as opposed to the SVM (81.6%) and RT (75.7%) classifiers for overall accuracy. From the perspective of a GIS analyst or coastal manager, the U-Net classifier is now an easily accessible nad powerful tool for mapping large areas. Change detection analysis indicated little areal change on marsh extent, though increased land development throughout the county has the potential to negatively impact the health of the marshes. Future work should explore applying the constructed U-Net classifier to coastal environments in large geographic areas, while also implementing other data sources (e.g., LIDAR, multispectral data) to enhance classification accuracy.

Read the full article here: https://www.mdpi.com/2220-9964/11/2/100/pdf

Population mobility and aging accelerate the outbreaks of COVID-19 in the Deep South: a county-level longitudinal analysis

Our new article titled “Population mobility and aging accelerate the outbreaks of COVID-19 in the Deep South: a county-level longitudinal analysis“, authored by Chengbo Zeng, Jiajia Zhang, Zhenlong Li, Xiaowen Sun, Xueying Yang, Bankole Olatosi, Sharon B Weissman, and Xiaoming Li, has been accepted for publication by Clinical Infectious Diseases (Impact Factor: 9.1).

We find that population mobility and aging at local areas contributed to the geospatial disparities in COVID-19 outbreaks among 418 counties in the Deep South. A significant interaction between mobility and proportion of older adults in predicting COVID-19 incidence was found. Effective disease control measures should be tailored to vulnerable communities.

New Award: A novel data-driven approach to empirically link structural racism and healthcare access and utilization in South Carolina

Dr. Zhenlong Li, collaborated with Dr. Shan Qiao from public health, has been awarded a project titled “A novel data-driven approach to empirically link structural racism and health access and utilization in South Carolina” by the UofSC OVPR Racial Justice and Equity Research Program. Other team members include Drs. Xiaoming Li, Bankole Olatosi, and Jiajia Zhang.

Leveraging large place visitation records with high granularity sampled from mobile devices and census data, we propose an integrative big data approach to examine the association between structural racism and disparities in health care access in South Carolina. The proposed research will develop innovative measurement tools to assess the racial/ethnical disparities in health care access and utilization in SC and explore spaciotemporal pattern of such disparities from 2018 to 2021. The findings will provide population level real-world data to address structural racism in SC and improve overall quality of care and population health, especially for African American communities.

“Studying patterns and predictors of HIV viral suppression using A Big Data approach: A research protocol” accepted for publication

Our new article titled “Studying patterns and predictors of HIV viral suppression using A Big Data approach: A research protocol”, co-authored by Zhang J., Olatosi B., Yang X., Weissman S., Li Z., Hu J., Li X, is accepted for publication by BMC Infectious Diseases. This is a peer-reviewed protocol article where the study has received ~3.5 million funding from NIH.

2021-2026, Patterns and Predictors of Viral Suppression: A Big Data Approach, National Institutes of Health (NIH), R01AI164947, MPI: Bankole Olatosi and Jiajia Zhang; Co-Investigators:  Zhenlong Li, Sharon Weissman, Jianjun Hu, Xiaoming Li,  $3,500,000

Welcome our new Postdoc Scholar Dr. Fengrui Jing to join GIBD team!

Dr. Fengrui Jing received his PhD in GIScience from Sun Yat-sen University in 2021. He also holds a master’s degree in Physical Geography and two undergraduate degrees in Social Work and Psychology. His research focuses on using massive social media data to map neighborhood disorder and fear of crime, and to examine the causal relationship between micro built environment and fear of crime.

Dr. Jing will work with Dr. Zhenlong Li and other team members in GIBD and USC Big Data Health Science Center (BDHSC, https://bigdata.sc.edu) to conduct cutting-edge and innovative interdisciplinary research on geospatial big data analytics (e.g., analyzing massive social sensing data and healthcare records) by using/developing advanced spatiotemporal analysis methods, statistical and predictive models, and computing algorithms and tools in the intersection of Science, data science, and health science.

Welcome Fengrui!

Exploring international travel patterns and connected communities for understanding the spreading risk of VOC Omicron

The novel SARS-CoV-2 variant of concern (VOC) Omicron (lineage B.1.1.529), together with four existing VOC variants, has raised serious concerns about the effectiveness of vaccines and the potential for a new wave of the pandemic (Figures 1 and 2) . This new strain was first detected in in November 2021 in South Africa and among international cases with a travel history from southern African countries. However, community transmission with associated clusters has now been reported in several countries. According to the COVID-19 Weekly Epidemiological Update published by the WHO, a total of 76 countries have reported confirmed cases of the Omicron variant, as of December 14, 2021 (Figure 3)……

Read the article here: https://www.worldpop.org/events/covid_omicron

Does distance still matter? Moderating effects of distance measures on the relationship between pandemic severity and bilateral tourism demand

New article titled “Does distance still matter? Moderating effects of distance measures on the relationship between pandemic severity and bilateral tourism demand”, authored by Yang Y., Zhang L., Wu L. and Li Z., has been accepted for publication by Journal of Travel Research (Impact factor: 10.982).

This study aims to investigate the moderating effects of various distance measures on the relationship between relative pandemic severity and bilateral tourism demand. After confirming its validity using actual hotel and air demand measures, we leveraged data from Google Destination Insights to understand daily bilateral tourism demand between 148 origin countries and 109 destination countries. Specifically, we estimated a series of fixed-effects panel data gravity models based on the year-over-year change in daily demand. Results show that a 10% increase in 7-day smoothed COVID-19 cases led to a 0.0658% decline in year-over-year demand change. The moderating distance measures include geographic, cultural, economic, social, and political distance. Results show that long-haul tourism demand was more affected by a destination’s pandemic severity relative to tourists’ place of origin. The moderating effect of national cultural dimensions indulgence versus constraints was also confirmed. Lastly, a discussion and implications for international destination marketing are provided.

“The times, they are a-changin’: tracking the shifts in mental health signals in Australia from the early to later phase of the COVID-19 pandemic” accepted by BMJ Global Health

Our new article titled “The times, they are a-changin’: tracking the shifts in mental health signals in Australia from the early to later phase of the COVID-19 pandemic” has been accepted for publication by BMJ Global Health (Impact Factor: 5.558).

—-Abstract—-

Introduction

Widespread problems of psychological distress have been observed in many countries following the outbreak of COVID-19, including Australia. What is lacking from current scholarship is a national-scale assessment that tracks the shifts in mental health during the pandemic timeline and across geographic contexts.

Methods

Drawing on 244,406 geotagged tweets in Australia from January 1, 2020 to May 31, 2021, we employed machine learning and spatial mapping techniques to classify, measure, and map changes in the Australian public’s mental health signals, and track their change across the different phases of the pandemic in eight Australian capital cities.

Results

Australians’ mental health signals, quantified by sentiment scores, have a shift from pessimistic (early pandemic) to optimistic (middle pandemic), reflected by a 174.1% [95% CI: 154.8, 194.5] increase in sentiment scores. However, the signals progressively recessed towards a more pessimistic outlook (later pandemic) with a decrease in sentiment scores by 48.8% [34.7, 64.9]. Such changes in mental health signals vary across capital cities.

Conclusion

We set out a novel empirical framework using social media to systematically classify, measure, map, and track the mental health of a nation. Our approach is designed in a manner that can readily be augmented into an ongoing monitoring capacity and extended to other nations. Tracking locales where people are displaying elevated levels of pessimistic mental health signals provide important information for the smart deployment of finite mental health services. This is especially critical in a time of crisis during which resources are stretched beyond normal bounds.

“Exploring the spatial disparity of home-dwelling time patterns in the U.S. during the COVID-19 pandemic via Bayesian inference” accepted by Transactions in GIS

Our paper titled “Exploring the spatial disparity of home-dwelling time patterns in the U.S. during the COVID-19 pandemic via Bayesian inference” has been accepted for publication by the Transactions in GIS. 

Abstract: In this study, we aim to reveal hidden patterns and confounders associated with policy implementation and adherence by investigating the home-dwelling stages from a data-driven perspective via Bayesian Inference with weakly informative priors and by examining how home-dwelling stages in the U.S. varied
geographically, using fine-grained, spatial-explicit home-dwelling time records from a multi-scale perspective. At the U.S. national level, two changepoints are identified, with the former corresponding to March 22, 2020 (nine days after the White House declared the National Emergency on March 13) and the latter corresponding to May 17, 2020. Inspections on the U.S. state and county level reveal notable spatial disparity in home-dwelling stages, presumably resulting from the discrepancies in political partisanship, COVID-19 severity, social distancing compliance, re-opening policy, and industry distribution. A pilot study in the Atlanta Metropolitan area at the Census Tract level reveals that the self-quarantine duration and increase in home-dwelling time are strongly correlated with the median household income, echoing existing efforts that document the economic inequity exposed by the U.S. stay-at-home orders. To our best knowledge, our work marks a pioneering effort to explore multi-scale home-dwelling patterns in the U.S. from a pure data-driven perspective and in a statistically robust manner.

Check out our new preprint: Deep Learning of High-Resolution Aerial Imagery for Coastal Marsh Change Detection: A Comparative Study

Please check out our new preprint titled “Deep Learning of High-Resolution Aerial Imagery for Coastal Marsh Change Detection: A Comparative Study“.

Deep learning techniques are increasingly being recognized as effective image classifiers. Aside from their successful performance in past studies, the accuracies have varied in complex environments in comparison with the popularly applied machine learning classifiers. This study seeks to explore the feasibility for using a U-Net deep learning architecture to classify bi-temporal high resolution county scale aerial images to determine the spatial extent and changes of land cover classes that directly or indirectly impact tidal marsh. The image set used in the analysis is a collection of a 1-m resolution collection of National Agriculture Imagery Program (NAIP) tiles from 2009 and 2019 covering Beaufort County, South Carolina. The U-net CNN classification results were compared with two machine learning classifiers, the Random Trees (RT) and the Support Vector Machine (SVM). The results revealed a significant accuracy advantage in using the U-Net classifier (92.4%) as opposed to the SVM (81.6%) and RT (75.7%) classifiers for overall accuracy. From the perspective of a GIS analyst or coastal manager, the U-Net classifier is now an easily accessible nad powerful tool for mapping large areas. Change detection analysis indicated little areal change on marsh extent, though increased land development throughout the county has the potential to negatively impact the health of the marshes. Future work should explore applying the constructed U-Net classifier to coastal environments in large geographic areas, while also implementing other data sources (e.g., LIDAR, multispectral data) to enhance classification accuracy.


“The promise of excess mobility analysis: measuring episodic-mobility with geotagged social media data” accepted by Cartography and Geographic Information Science

Our new paper titled “The promise of excess mobility analysis: measuring episodic-mobility with geotagged social media data” is accepted for publication in the Cartography and Geographic Information Science.

Abstract: Human mobility studies have become increasingly important and diverse in the past decade with the support of social media big data that enables human mobility to be measured in a harmonized and rapid manner. However, what is less explored in the current scholarship is episodic mobility as a special type of human mobility defined as the abnormal mobility triggered by episodic events excess to the normal range of mobility at large. Drawing on a large-scale systematic collection of 1.9 billion geotagged Twitter data from 2017 to 2020, this study contributes the first empirical study of episodic mobility by producing a daily Twitter census of visitors at the U.S. county level and proposing multiple statistical approaches to identify and quantify episodic mobility. It is followed by four case studies of episodic mobility in U.S. national wide to showcase the great potential of Twitter data and our proposed method to detect episodic mobility subject to episodic events that occur both regularly and sporadically. This study provides new insights on episodic mobility in terms of its conceptual and methodological framework and empirical knowledge, which enriches the current mobility research paradigm.

Read the full article here.

The book “Manual of Digital Earth” published by the International Society for Digital Earth reached a total of 856,000 downloads

The Manual of Digital Earth, an eBook published by International Society for Digital Earth and co-edited by Prof. Huadong Guo, Prof. Mike Goodchild, and Dr. Alessandro has reached a total of 856000 downloads since its publication in November 2019.

This open access book offers a summary of the development of Digital Earth over the past twenty years. By reviewing the initial vision of Digital Earth, the evolution of that vision, the relevant key technologies, and the role of Digital Earth in helping people respond to global challenges, this publication reveals how and why Digital Earth is becoming vital for acquiring, processing, analyzing and mining the rapidly growing volume of global data sets about the Earth. The book is free available at: https://link.springer.com/book/10.1007/978-981-32-9915-3#toc

Zhenlong Li is the leading author of the chapter: Geospatial Information Processing Technologies, freely available at https://link.springer.com/chapter/10.1007/978-981-32-9915-3_6  (co-authors: Zhenlong Li, Zhipeng Gui ,Barbara Hofer ,Yan Li ,Simon Scheider ,Shashi Shekhar)

Chapter Abstract: The increasing availability of geospatial data offers great opportunities for advancing scientific discovery and practices in society. Effective and efficient processing of geospatial data is essential for a wide range of Digital Earth applications such as climate change, natural hazard prediction and mitigation, and public health. However, the massive volume, heterogeneous, and distributed nature of global geospatial data pose challenges in geospatial information processing and computing. This chapter introduces three technologies for geospatial data processing: high-performance computing, online geoprocessing, and distributed geoprocessing, with each technology addressing one aspect of the challenges. The fundamental concepts, principles, and key techniques of the three technologies are elaborated in detail, followed by examples of applications and research directions in the context of Digital Earth. Lastly, a Digital Earth reference framework called discrete global grid system (DGGS) is discussed.

Special Issue call for papers: Spatial Analytics for COVID-19 Studies in the International Journal of Environmental Research and Public Health

Zhenlong Li is co-guest editing a Special Issue entitled “Spatial Analytics for COVID-19 Studies” for the International Journal of Environmental Research and Public Health (ISSN 1660-4601, IF 3.390, http://www.mdpi.com/journal/ijerph).

IJERPH is an open access journal indexed by SCI, SSCI, Scopus, and PubMed. According to Web of Science, IJERPH ranks 118/274 (Q2) in “Environmental Sciences” (SCIE), 68/203 (Q2) in “Public, Environmental, and Occupational Health” (SCIE), and 41/176 (Q1) in “Public, Environmental, and Occupational Health” (SSCI). The median processing time for submissions is less than 45 days, which includes a free English editing service after acceptance of the paper. The article processing charge (APC) is CHF 2300 (Swiss Francs) per accepted paper.


Dear Colleagues,

Coronavirus disease 2019 (COVID-19) is a global threat that has led to many health, economic, and social challenges. The spread of the severe acute respiratory syndrome coronavirus-2 (SARS-CoV-2) that caused the COVID-19 pandemic is inherently a spatial process. Therefore, geospatial data, algorithms, models, tools, and platforms play an irreplaceable role in providing situational awareness that benefits decision making. The notable advances in Geographical Information Sciences (GIScience) have encouraged the incorporation of spatial analytics into various epidemiological studies over the past decade.

In this Special Issue, we focus on the development and application of advanced spatial analytics towards understanding the transmission and impacts of COVID-19. We invite contributions that address this general topic from a broad spectrum of data sources (public health, economics, socio-demographics, social media, mobile phone data, transportation records, surveys, etc.) and via a variety of spatial analytics including (but not limited to) spatial statistics, agent-based simulation, digital contact tracing, case forecasting, disease transmission modeling, geo-aware analysis, spatiotemporal prediction, intelligent algorithms (i.e., machine learning and deep learning), and big data analytics. We also welcome studies that produce, design, and develop shareable COVID-19 modeling-related data, online visualization/analytical platforms, and reusable analytical tools, packages, and models.

Dr. Tao Hu
Dr. Zhenlong Li
Dr. Xiao Huang
Guest Editors

More information can be found on the Special Issue website: https://www.mdpi.com/journal/ijerph/special_issues/Spatial_COVID_19

GIBD is organizing a series of sessions on geospatial big data and spatial computing in the 2022 AAG annual meeting

GIBD is organizing a series of sessions on the topics of big data computing, disaster management, human mobility, and public health in the 2022 AAG annual meeting


Harnessing Geospatial Big Data for Infectious Diseases


Type: Virtual Paper

Sponsor Group(s):  Cyberinfrastructure Specialty Group

Organizer(s):

Zhenlong Li, Shengjie Lai, Bo Huang, Kathleen Stewart

Public health is inextricably linked to geospatial context. Where, when, and how people interact with natural, social, built, economic and cultural environments directly influence human health outcomes, policy making, planning and implementation, especially for infectious diseases such as COVID-19, HIV, and influenza. Geospatial data has long been used in health studies, dating back to John Snows’ groundbreaking mapping of cholera outbreaks in London, and continuing today in a wide range of scientific inquiries, e.g., examining the effects of environmental, neighborhood, and demographic factors on health outcomes, understanding accessibility and utilization of health services, modeling the spread of infectious diseases, assessing the effectiveness of disease interventions, and developing better healthcare strategies to improve health outcomes and equity.

Emerging sources of geospatial big data, such as data collected from social sensing, remote sensing, and health sensing (health wearables) contain rich information about the environmental, social, population, and individual factors for health that are not available in traditional health data and population statistics. Along with innovative spatial and computing methodologies in GIScience, geospatial big data provides unprecedented opportunities for advancing the infectious disease research. The ongoing COVID-19 pandemic further highlights the demand on and the power of big data and spatial analysis in modeling, simulating, mapping, and predicting the spread of infectious diseases and their intervention across the world.

Along these lines, this paper session aims to capture recent advancements in leveraging geospatial big data and spatial analysis in infectious disease-related research, such as disease mapping and cluster detection, early detection and warning of disease outbreaks, and spatial analysis and modeling of disease spread and control. Potential topics include (but are not limited to) the following:

• Collection, processing, and integration of geospatial big data (e.g., satellite images, floor plans, 3D models, social media and mobile phone data) with health big data (e.g., electronic medical records) to extract geospatial context at various spatiotemporal scales (e.g., environmental risks, socioeconomic factors,and population mobility) to address infectious disease questions.
• Innovative methodologies for geospatial big data analytics in the context of infectious diseases, including geocomputation algorithms and geostatistical models. For example, assessing the effectiveness of non-pharmaceutical interventions in preventing the resurgence of COVID-19 using human mobility data.
• Combining geospatial big data with advanced computing technologies such as machine learning (ML) and geospatial artificial intelligence (GeoAI) to uncover hidden patterns and new information in infectious diseases related to, for example, the spreading, disparity, morbidity, and mortality of COVID-19.
• Developing accessible and reusable geovisualization and mapping methods, sharable data products, and online tools that help foster multidisciplinary collaborations, engage community and facilitate public understanding and decision making during disease outbreaks such as the COIVD-19 pandemic.


AAG 2022 Symposium on Data-Intensive Geospatial Understanding in the Era of AI and CyberGIS: Big Data Computing for Geospatial Applications


Type: Virtual Paper

Sponsor Group(s): Cyberinfrastructure Specialty Group

Organizer(s):Zhenlong Li, Qunying Huang, Eric Shook, Wenwu Tang

Earth observation systems and model simulations are generating massive volumes of disparate, dynamic, and geographically distributed geospatial data with increasingly finer spatiotemporal resolutions. Meanwhile, the ubiquity of smart devices, location-based sensors, and social media platforms provide extensive geo-information about daily life activities. Efficiently analyzing those geospatial big data streams enables us to investigate complex patterns and develop new decision-support systems, thus providing unprecedented values for sciences, engineering, and business. However, handling the five “Vs” (volume, variety, velocity, veracity, and value) of geospatial big data is a challenging task as they often need to be processed, analyzed, and visualized in the context of dynamic space and time.

This section aims to capture the latest efforts on utilizing, adapting, and developing new computing approaches, spatial methods, and data management strategies to tackle geospatial big data challenges for supporting geospatial applications in different domains such as climate change, disaster management, human dynamics, public health, and environment and engineering.

Potential topics include (but are not limited to) the following:
• Geo-cyberinfrastructure integrating spatiotemporal principles and advanced computational technologies (e.g., high-performance computing, cloud computing, and deep learning/GeoAI).
• New computing and programming frameworks and architecture or parallel computing algorithms for geospatial applications.
• New geospatial data management strategies and data storage models coupled with high-performance computing for efficient data query, retrieval, and processing (e.g., new spatiotemporal indexing mechanisms).
• New computing methods considering spatiotemporal collocation (locations and relationships) of users, data, and computing resources.
• Geospatial big data processing, mining and visualization methods using high-performance computing and artificial intelligence.
• Other research, development, education, and visions related to geospatial big data computing.


Symposium on Data-Intensive Geospatial Understanding in the Era of AI and CyberGIS: Urban Sensing and Understanding via Big Visual Data


Type: Virtual Paper

Organizer(s):

Huan Ning, Zhenlong Li, Yuqin Jiang

Cites are being watched by an increasing number of cameras. Besides the conventional traffic and security cameras, others are found in smartphones, self-driving vehicles, and drones. Massive visual data are being collected every day around the world and the volume keeps growing. For example, Instagram users upload millions of photos per hour; Google Street View provides images for most streets in major cities worldwide; autonomous cars gather images around them every second when running on the roads. These visual big data, combined with embedded location information, offer unprecedented opportunities to discover patterns and knowledge in urban environments. For example, analyzing massive images/videos captured in urban areas can help researchers uncover urban phenomena quantitatively and qualitatively, such as how visitors use public parks, what kind of people visit a landmark frequently, or where is being gentrified. Besides resident behavior analysis, municipal facility administration also benefits from harnessing urban images/video, for example, street furniture inventorying, sidewalk mapping, street tree species detection and diameter measuring, and neighborhood walkability assessments.

The tremendous advancements in artificial intelligence and computer vision over the last decade have resulted in powerful tools for extracting semantic information from images/videos. However, it is unclear that what kind of new technology and data sources can be used or need to be developed, and how they help people to capture the dynamic of urban life and to understand the interaction between residents and urban environments. This session aims to capture the recent advancements on using big visual data to sense and understand urban environments, including conceptualization, knowledge framework, toolbox organization, and applications. The ultimate goal is to enhance the productivity of urban management and the life of city residents.

Potential topics include, but are not limited to, the following:
• Exploration of the definitions and sources of urban image/video big data
• Spatiotemporal scales of big visual data in urban settings
• Technology on capturing, storing, processing, and analyzing of massive urban images/videos
• General data processing and analyzing frameworks for urban big visual data
• Social or physical phenomena mining and visualization in urban areas using visual data
• Data representation and fusion of visual information and other observations in urban environments, such as text, sound, demography, and activities in cyberspace
• Privacy policies of urban images/videos
• Interdisciplinary applications based on urban big visual data


Symposium on Human Dynamics Research: Human mobility in Big Data Era I & II


Type: In-Person Paper

Sponsor Group(s): 

Cyberinfrastructure Specialty Group, Geographic Information Science and Systems Specialty Group, Transportation Geography Specialty Group

Organizer(s):

Yuqin Jiang, Zhenlong Li, Xiao Huang

“Human mobility” is a commonly used but loosely defined term which represents the concept about people’s spatiotemporal occupation and involves interaction among human, society, and surrounding physical environment. Better understanding human mobility is essential for understanding human interactions with surrounding environment and the use of geographic space, which can benefit transportation and urban planning, political decision making, epidemiology, economic development, emergency management, and many other fields. Human activities have been producing massive amount of geospatial data. Recent technology advancements further pushed the volume, variety, and velocity of human mobility to an unprecedented level. How to efficiently process, analyze, and make sense of the massive human movement data remains challenging, especially within dynamic spatial and temporal context. This session aims to capture the latest efforts in analyzing human movement data and revealing human movement patterns that contributes to a better understanding of human activities and their surrounding environment under various circumstances and within different domains, such as transportation, social networks, public health, urban analysis, and emergency management.

Potential topics include, but not limited to, the following:
• Human mobility data capturing, storing, processing and analyzing
• Methodological improvements in human movement data mining, pattern analysis, and visualization
• Understanding changes in human mobility patterns under the COVID-19 pandemic
• Quantifying human mobility pattern changes
• Modeling human mobility during different events, for instance, hurricane evacuation
• Interdisciplinary applications with spatiotemporal human mobility data


Urban Computational Paradigms with Shareable Data, Models, Tools, and Frameworks


Type: Virtual Paper

Sponsor Group(s): 

Geographic Information Science and Systems Specialty Group, Cyberinfrastructure Specialty Group, Spatial Analysis and Modeling Specialty Group

Organizer(s):

Xiao Huang, Xinyue Ye, Zhenlong Li

Although the Big Data Era provides countless opportunities with the emerging of innovative data sources, it also poses new challenges, among which reproducibility and replicability (R & R) are facing a growing awareness. The extensive usage of urban monitoring big data, such as satellite imagery, location-based services, street views, to list a few, uniquely emphasizes the importance of R & R in Urban Science from the intertwining perspectives of location privacy, geospatial data quality, computing scalability, geoinformation shareability, and conclusion generalizability. To support reproducible computational studies, Choi et al. (2021) identified three thrusts: 1) open sharing of data and models online; 2) encapsulating computational models through containers and self-documented tutorials; 3) developing Application Programming Interfaces (APIs) for programmatic control of complex computational models. In addition, other venues exist where R & R can be promoted, such as the development of visualization frameworks, data-sharing portals, and integrated cyberinfrastructures. In response to the R & R challenges in Urban Science and the growing open-sourcing trend in academia, this session encourages the submission of abstracts that focus on tackling urban issues and problems by designing shareable data/products, developing analytical tools, launching online data visualization portals, constructing integrated cyberinfrastructures, and so on. Submitted abstracts could cover but are not limited to the following themes:

• Shareable urban monitoring data and products that benefit urban science communities.
• Online visualization, analytical, and data-sharing platforms that promote and facilitate data- and knowledge-sharing for both academia and the public.
• Development of reusable and interoperable analytical tools, packages, models, and data-accessing portals/APIs that advance urban sciences.
• Applied urban studies using designed data products, models, tools, and platforms.
• Research agenda and visions related to reproducibility and replicability in urban science.
• Urban monitoring and analytics using sharable data and platforms


Uncertainties in Big Data Analytics in Disaster Research


Type: Virtual Paper

Sponsor Group(s): 

Geographic Information Science and Systems Specialty Group, Hazards, Risks, and Disasters Specialty Group

Organizer(s):

Edwin Chow, Zhenlong Li, Qunying Huang

The growth of information and communication technologies (ICT) has enabled citizen participation in scientific investigation (a.k.a. citizen science) and sharing of data and information via social media (e.g., Twitter) and social networking sites (e.g., Facebook). The advancements in Internet of Things (IoTs) and connected devices including drones and aerial robotics have enabled the use of social media generated big data to understand human dynamics, and their interaction with the built environments. Significant advancements have been made to collect and analyze these data for emergency response, risk communication, mobility studies among others.

The big data derived from citizen sensors tend to suffer from a myriad of uncertainties in terms of positional accuracy, context ambiguity, credibility, reliability, representativeness and completeness. Moreover, there are also serious concerns about data provenance and privacy. While there is no shortage in big data applications, the quality issue of these data remains an intellectual and practical challenge. A lack of data provenance for these data combined with unavailability of high-quality reference data appropriate to its enormous volume, heterogeneous structure in near real-time make it difficult to evaluate the quality of these data. Moreover, the notion of “ground truth” in social science research is subjected to the discourse of space-place dichotomy, the spatial and contextual randomness in human behaviors. The heterogeneous nature of these data in terms of data structure and content requires tremendous amount of processing at various stages of analytics before the data could be integrated with other geospatial datasets for decision-making purposes. Privacy awareness is of increasing importance to data management, dissemination and distribution in many research projects. Although aggregation, permutation or masking techniques can be used to protect data privacy without compromising the overall quality of data, its effectiveness depends on the degree of distribution heterogeneity of the geographic phenomenon. This session welcomes basic and empirical research that advances existing understanding and techniques to address the quality issue of big data generated from social media and its impact on applications pertaining to human dynamics, built environments and hazards. Possible topics may include but are not limited to:

• Quality issues in social media big data
• Challenges in collecting, processing and analyzing big data for real-time applications
• Big data quality and its impact in decision making
• Calibration and validation techniques/approaches in big data
• Data fusion of multi-source and/or heterogeneous datasets
• Big data analytics in hazards and built-environment
• Big data analytics in human movements and behaviors during disasters
• Geo-visualization techniques to analyze and visualize social media data
• Privacy and big data management
• Provenance and metadata generation
• Applications of machine-learning and computer vision in disaster research
• New methods to measure social media credibility of social media content and users
• Influential social media user detection

Final Call for Papers: Special Issue “GIScience for Risk Management in Big Data Era” in ISPRS International Journal of Geo-Information

GIScience for Risk Management in Big Data Era

Deadline for manuscript submissions: 31 October 2021.


This Special Issue aims to capture recent efforts and advancements in harnessing the power of GIScience for risk management in the big data era.

The first group of possible topics is to inspire potential authors to deal with basic and new trends related to the big data era. The contribution of novel approaches to spatial data collection (social networks, sensors, citizen science, VGI, etc.), disaster big data processing and sharing, real-time data-centric intelligence based on sensors, harmonization of heterogeneous data into a single structure, cybersecurity of geographical information systems and others, is welcomed, along with analyses and commentary.

The second thematic block will cover cartography and GIS theories such as mobile disaster cartography, concepts, ontologization and standardization, cross-cultural aspects of disaster cartography, investigation of the psychological condition of end-users given by their personal character and situation, and the psychological condition of rescued persons are offered together with questions that are still open on the mapping methodologies and technologies for EW&CM from children and senior perspectives.

The third group of topics aims to address mapping and visualization techniques. Dynamic and real-time cartographic visualization concepts and techniques for enhanced operational activities for selected EW, DRM, and DRR purposes are highlighted. Included in the same group are both virtual environments for EW, DRM, and DRR as well as 3D analysis and visualization of disaster events.

The last group of topics is devoted to services and applications, and may include analyses and descriptions of location-based services for emergencies (web services, etc.), multimodal emergency positioning, mapping based on social big data, internet of things for solutions and visualizations, and disaster chain modeling.

In particular, potential inspiring topics for authors include the following:

Big data
Novel approaches to spatial data collection (social networks, sensors, citizen science, VGI, etc.)
Geospatial big data computing, analytics, and sharing for disaster management
Real-time data-centric intelligence based on sensors for purposes of DRM and DRR harmonization and homogenization of heterogenous data.
Searching and calculations of anomalies in geospatial big data in DRM and DRR process
Cartographic use of remotely sensed and other geospatial data for early warning, DRM, and DRR
Cybersecurity of geographical information systems (of data flows from sensor networks to GIS platforms)
Cartography and GIS theories

Mobile disaster cartography
Concepts, ontologization, and standardization for early warning, hazard, risk, and vulnerability mapping
Mechanisms of command and control systems integration
Cross-cultural aspects of disaster cartography (traditions, universality, and conventions and their integration)
Investigation of the psychological condition of end-users given by their personal character and situation and the psychological condition of rescued persons
Mapping methodologies and technologies for EW&CM from the perspectives of children and seniors. Designing, understanding, and using maps for EW, DRM, and DRR for children and seniors

Mapping and visualization techniques
Dynamic and real-time cartographic visualization concepts and techniques for enhanced operational early warning and DRM activities for selected purposes (various government levels, inter-state cooperation, first aid, etc.)
Virtual environments for EW and DRR (geographic, indoors, underground, etc.)
3D disaster (floods, fires, slides, tsunamis, etc.) analysis and visualization

Services and application
Location-based service for emergencies
Multimodal emergency positioning
Disaster risk analyses and mapping using social big data
Internet of things (IoT) in disaster solutions and visualizations
Disaster chain modeling

Special Issue Editors

Prof. Dr. Milan Konecny Website
Guest Editor
Laboratory on Geoinformatics and Cartography, Department of Geography, Faculty of Science, Masaryk University, Kotlarska 2, 61137 BRNO, Czech Republic
Interests: disaster risk reduction; disaster mapping; context and adaptive cartography; health cartography; big spatial data

Prof. Dr. Jie Shen Website
Guest Editor
School of Geography, Nanjing Normal University, Wenyuna Road 1, 210023, Nanjing, China
Interests: disaster mapping; context and adaptive cartography; indoor navigation; map genreralization

Prof. Dr. Zhenlong Li Website
Guest Editor
Geoinformation and Big Data Research Laboratory (GIBD), Department of Geography, University of South Carolina, Columbia, SC 29208, USA
Interests: GIScience; geospatial big data; social media analytics; high performance computing; CyberGIS; GeoAI

https://www.mdpi.com/si/61242

New paper published in the International Journal of Environmental Research and Public Health

Our paper entitled “Temporal Geospatial Analysis of COVID-19 Pre-infection Determinants of Risk in South Carolina”, co-authored by Tianchu Lyu, Nicole Hair, Nicholas Yell, Zhenlong Li, Shan Qiao, Chen Liang , and Xiaoming Li, is published in the International Journal of Environmental Research and Public Health.

Abstract: Disparities and their geospatial patterns exist in morbidity and mortality of COVID-19 patients. When it comes to the infection rate, there is a dearth of research with respect to the disparity structure, its geospatial characteristics, and the pre-infection determinants of risk (PIDRs). This work aimed to assess the temporal–geospatial associations between PIDRs and COVID-19 infection at the county level in South Carolina. We used the spatial error model (SEM), spatial lag model (SLM), and conditional autoregressive model (CAR) as global models and the geographically weighted regression model (GWR) as a local model. The data were retrieved from multiple sources including USAFacts, U.S. Census Bureau, and the Population Estimates Program. The percentage of males and the unemployed population were positively associated with geodistributions of COVID-19 infection (p values < 0.05) in global models throughout the time. The percentage of the white population and the obesity rate showed divergent spatial correlations at different times of the pandemic. GWR models fit better than global models, suggesting nonstationary correlations between a region and its neighbors. Characterized by temporal–geospatial patterns, disparities in COVID-19 infection rate and their PIDRs are different from the mortality and morbidity of COVID-19 patients. Our findings suggest the importance of prioritizing different populations and developing tailored interventions at different times of the pandemic.

Read full article here.

Manuscript accepted for publication by the International Journal of Geographical Information Science, a flagship journal in GIScience!

A new article led by Huan Ning, titled “Exploring the Vertical dimension of Street View Image Based on Deep Learning: A Case Study on Large-scale Building Flooding Risk Assessment”, has been accepted for publication in the International Journal of Geographical Information Science, a flagship journal in GIScience.

Congratulations, Huan!

“ODT FLOW: Extracting, analyzing, and sharing multi-source multi-scale human mobility” accepted for publication by Plos One

Abstract: In response to the soaring needs of human mobility data, especially during disaster events such as the COVID-19 pandemic, and the associated big data challenges, we develop a scalable online platform for extracting, analyzing, and sharing multi-source multi-scale human mobility flows. Within the platform, an origin-destination-time (ODT) data model is proposed to work with scalable query engines to handle heterogenous mobility data in large volumes with extensive spatial coverage, which allows for efficient extraction, query, and aggregation of billion-level origin-destination (OD) flows in parallel at the server-side. An interactive spatial web portal, ODT Flow Explorer, is developed to allow users to explore multi-source mobility datasets with user-defined spatiotemporal scales. To promote reproducibility and replicability, we further develop ODT Flow REST APIs that provide researchers with the flexibility to access the data programmatically via workflows, codes, and programs. Demonstrations are provided to illustrate the potential of the APIs integrating with scientific workflows and with the Jupyter Notebook environment. We believe the platform coupled with the derived multi-scale mobility data can assist human mobility monitoring and analysis during disaster events such as the ongoing COVID-19 pandemic and benefit both scientific communities and the general public in understanding human mobility dynamics.


Read the full article here

“Human Mobility Data in the COVID-19 Pandemic: Characteristics, Applications, and Challenges” accepted for publication by International Journal of Digital Earth

Review article entitled “Human Mobility Data in the COVID-19 Pandemic: Characteristics, Applications, and Challenges” accepted for publication by the International Journal of Digital Earth (2020 Impact Factor: 3.538)

Read preprint here.

Abstract: The COVID-19 pandemic poses unprecedented challenges around the world. Many studies indicate that human mobility data provide significant support for public health actions during the pandemic. Researchers have applied mobility data to explore spatiotemporal trends over time, investigate associations with other variables, and predict or simulate the spread of COVID-19. Our objective was to provide a comprehensive overview of human mobility open data to guide researchers and policymakers in conducting data-driven evaluations and decision-making for the COVID-19 pandemic and other infectious disease outbreaks. We summarized the mobility data usage in COVID-19 studies by reviewing recent publications on COVID-19 and human mobility from a data-oriented perspective. We identified three major sources of mobility data: public transit systems, mobile operators, and mobile phone applications. Four approaches have been commonly used to estimate human mobility: public transit-based flow, social activity patterns, index-based mobility data, and social media-derived mobility data. We compared mobility datasets’ characteristics by assessing data privacy, quality, space-time coverage, high-performance data storage and processing, and accessibility. We also present challenges and future directions of using mobility data. This review makes a pivotal contribution to understanding the use of and access to human mobility data in the COVID-19 pandemic and future disease outbreaks.
Zhenlong Li will give a presentation in the webinar “Social Computing for Geographic Information Science: Which Data, Tools, and Methods for Analyzing Mobility?”

Dr. Zhenlong Li is invited to give a presentation titled “Big Social Media Data to Measure Place Connectivity and Human Mobility Dynamics” in the Webinar “Social Computing for Geographic Information Science: Which Data, Tools, and Methods for Analyzing Mobility?”, organized by Dr. Arianna D’Ulizia, Prof. Dr. Patrizia Grifoni, and Prof. Dr. Fernando Ferri from the National Research Council (CNR), Institute for Research on Population and Social Policies (IRPPS), Italy.

Date: 9 July 2021

Time: 3:00pm CEST | 9:00am EDT | 9:00pm CST Asia

More information and registration: https://ijgi-1.sciforum.net/


Zhenlong Li gave an invited presentation at the Oak Ridge National Laboratory

Zhenlong Li gave an invited presentation titled “Measuring Human Mobility Dynamics and Place Connectivity Using Big Social Media Data” at Geospatial Science and Human Security Division Director Seminar Series of the Oak Ridge National Laboratory on June 24, 2021.

Abstract: Understanding human mobility dynamics among places provides fundamental knowledge regarding their interactive gravity, benefiting a wide range of applications in need of knowledge in human spatial interactions. The ongoing COVID-19 pandemic uniquely highlights the need for monitoring, measuring, and predicting human movement at various geographic scales from local to global. This talk first introduces our recent effort in quantifying global human movement using billions of geotagged tweets coupled with big data computing, and then presents a global multi-scale place connectivity index (PCI) derived from such movement. Two application examples are followed to exemplify the utility of PCI as a factor in 1) predicting the spatial spread of COVID-19 during the early stage, and 2) predicting hurricane evacuation destination choices.

Article “A novel big data approach to measure and visualize urban accessibility” is published in Computational Urban Science

A new article titled “A novel big data approach to measure and visualize urban accessibility”, authored by Yuqin Jiang, Diansheng Guo, Zhenlong Li, and Michael Hodgson, is published in Computational Urban Science.

Abstract: Accessibility is a topic of interest to multiple disciplines for a long time. In the last decade, the increasing availability of data may have exceeded the development of accessibility modeling approaches, resulting in a modeling gap. In part, this modeling gap may have resulted from the differences needed for single versus multimodal opportunities for access to services. With a focus on large volumes of transportation data, a new measurement approach, called Urban Accessibility Relative Index (UARI), was developed for the integration of multi-mode transportation big data, including taxi, bus, and subway, to quantify, visualize and understand the spatiotemporal patterns of accessibility in urban areas. Using New York City (NYC) as the case study, this paper applies the UARI to the NYC data at a 500-m spatial resolution and an hourly temporal resolution. These high spatiotemporal resolution UARI maps enable us to measure, visualize, and compare the variability of transportation service accessibility in NYC across space and time. Results demonstrate that subways have a higher impact on public transit accessibility than bus services. Also, the UARI is greatly affected by diurnal variability of public transit service.

Read full article here: https://doi.org/10.1007/s43762-021-00010-1

Article “Introducing Twitter Daily Estimates of Residents and Non-Residents at the County Level” published in Social Sciences

A new article titled “Introducing Twitter Daily Estimates of Residents and Non-Residents at the County Level”, authored by Yago Martin, Zhenlong Li, Yue Ge, and Xiao Huang, is published in Social Sciences.

Abstract: The study of migrations and mobility has historically been severely limited by the absence of reliable data or the temporal sparsity of available data. Using geospatial digital trace data, the study of population movements can be much more precisely and dynamically measured. Our research seeks to develop a near real-time (one-day lag) Twitter census that gives a more temporally granular picture of local and non-local population at the county level. Internal validation reveals over 80% accuracy when compared with users’ self-reported home location. External validation results suggest these stocks correlate with available statistics of residents/non-residents at the county level and can accurately reflect regular (seasonal tourism) and non-regular events such as the Great American Solar Eclipse of 2017. The findings demonstrate that Twitter holds the potential to introduce the dynamic component often lacking in population estimates. This study could potentially benefit various fields such as demography, tourism, emergency manage

ment, and public health and create new opportunities for large-scale mobility analyses.

Read full article here: https://www.mdpi.com/2076-0760/10/6/227/pdf

Staying at home is a privilege: evidence from fine-grained mobile phone location data in the U.S. during the COVID-19 pandemic

A new article “Staying at home is a privilege: evidence from fine-grained mobile phone location data in the U.S. during the COVID-19 pandemic” led by Dr. Xiao Huang is published in the Annals of the American Association of Geographers.  Congratulations to Xiao and his team!!

Abstract: The coronavirus disease 2019 (COVID-19) has exposed and, to some degree, exacerbated social inequity in the United States. This study reveals the correlation between demographic and socioeconomic variables and home-dwelling time records derived from large-scale mobile phone location tracking data at the U.S. census block group (CBG) level in the twelve most populated Metropolitan Statistical Areas (MSAs) and further investigates the contribution of these variables to the disparity in home-dwelling time that reflects the compliance with stay-at-home orders via machine learning approaches. We find statistically significant correlations between the increase in home-dwelling time (∇HDT) and variables that describe economic status in all MSAs, which is further confirmed by the optimized random forest models, because median household income and percentage of high income are the two most important variables in predicting ∇HDT. The partial dependence between median household income and ∇HDT reveals that the contribution of income to ∇HDT is place dependent, nonlinear, and different given varying income intervals. Our study reveals the luxury nature of stay-at-home orders with which lower income groups cannot afford to comply. Such disparity in responses under stay-at-home orders reflects the long-standing social inequity issues in the United States, potentially causing unequal exposure to COVID-19 that disproportionately affects vulnerable populations. We must confront systemic social inequity issues and call for a high-priority assessment of the long-term impact of COVID-19 on geographically and socially disadvantaged groups.

Read full paper here. 

https://www.tandfonline.com/doi/full/10.1080/24694452.2021.1904819