
Special Issue: Harnessing Geospatial Big Data for Infectious Diseases
We are launching a new Special Issue “Harnessing Geospatial Big Data for Infectious Diseases” in the International Journal of Applied Earth Observation and Geoinformation (Elsevier, Impact Factor: 7.672).
 Public health is inextricably linked to geospatial context. Where, when, and how people interact with natural, social, built, economic and cultural environments directly influences human health outcomes, policy making, planning and implementation, especially for infectious diseases such as COVID-19, HIV, and influenza. Geospatial data has long been used in health studies, dating back to John Snows’ groundbreaking mapping of cholera outbreaks in London, and continuing today in a wide range of scientific inquiries, e.g., examining the effects of environmental, neighborhood, and demographic factors on health outcomes, understanding accessibility and utilization of health services, modeling the spread of infectious diseases, assessing the effectiveness of disease interventions, and developing better healthcare strategies to improve health outcomes and equity.
Emerging sources of geospatial big data, such as data collected from social sensing, remote sensing, and health sensing (health wearables) contain rich information about the environmental, social, population, and individual factors for health that are not available in traditional health data and population statistics. Along with innovative spatial and computing methodologies in GIScience, geospatial big data provides unprecedented opportunities for advancing the infecious disease research. The ongoing COVID-19 pandemic further highlights the demand on and the power of big data and spatial analysis in modeling, simulating, mapping, and predicting the spread of infectious diseases and their intervention across the world.
Guest Editors:
- Dr. Zhenlong Li, Penn State University, USA
- Dr. Shengjie Lai, University of Southampton, UK
- Dr. Kathleen Stewart, University of Maryland, USA
- Dr. Bo Huang, Chinese University of Hong Kong, China
- Dr. Xiaoming Li, University of South Carolina, USA
Published articles in this special issue:
More details here.
Place Visitation Data Reveals the Geographic and Racial Disparities of COVID-19 Impact on HIV Service Utilization in the Deep South
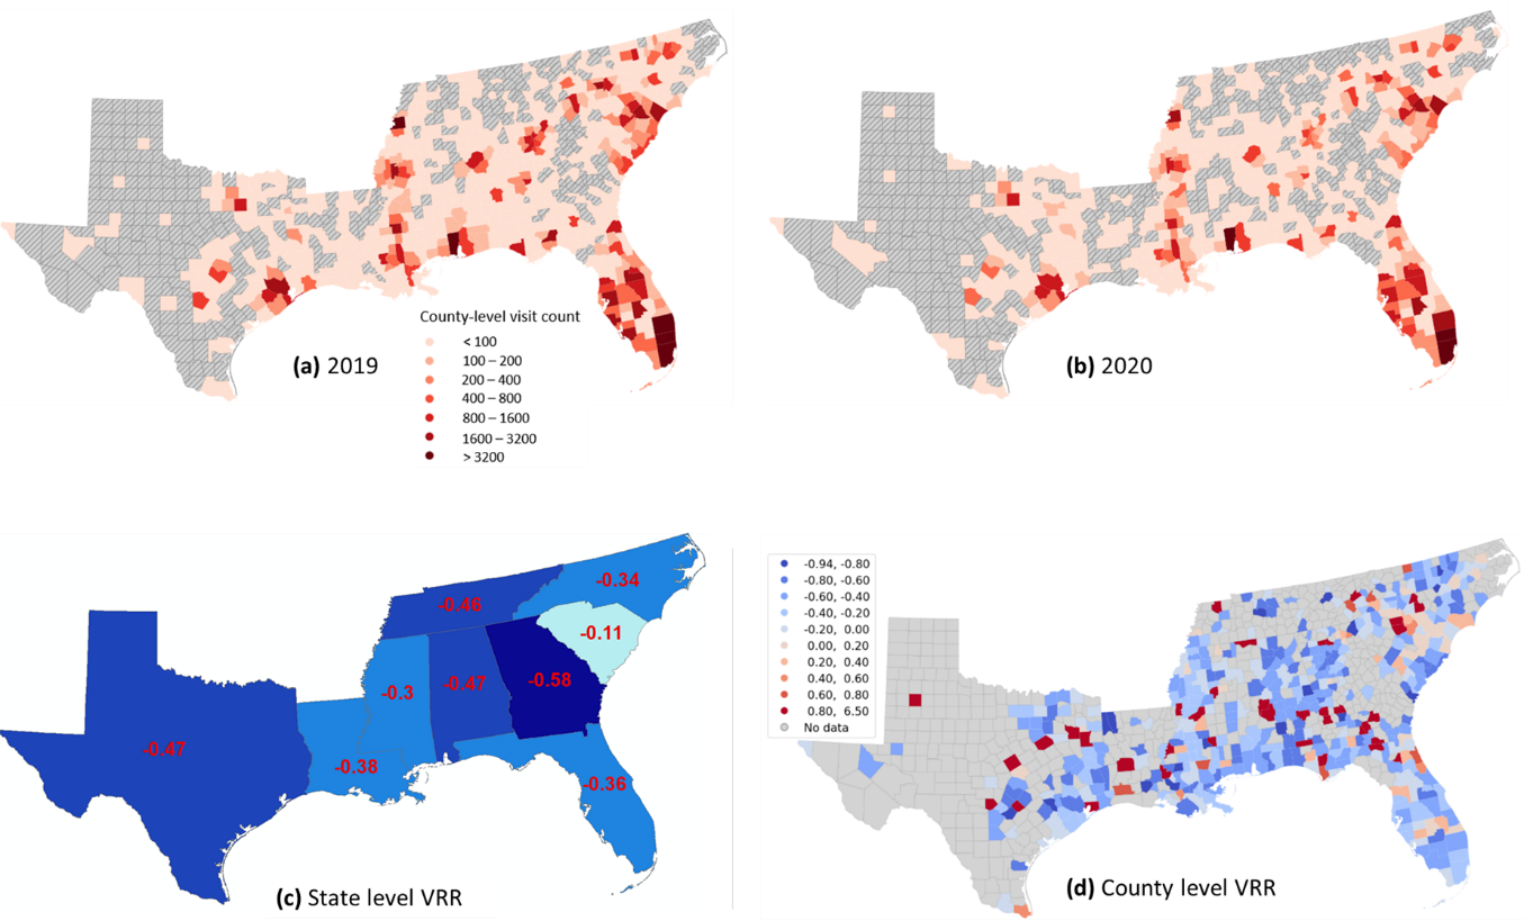
Geographic distribution of home counties for Ryan White HIV facilities visitations in 2019 (a) and 2020 (b), and spatial distribution of state level visitation reduction rate (c); county-level visitation reduction rate (d)
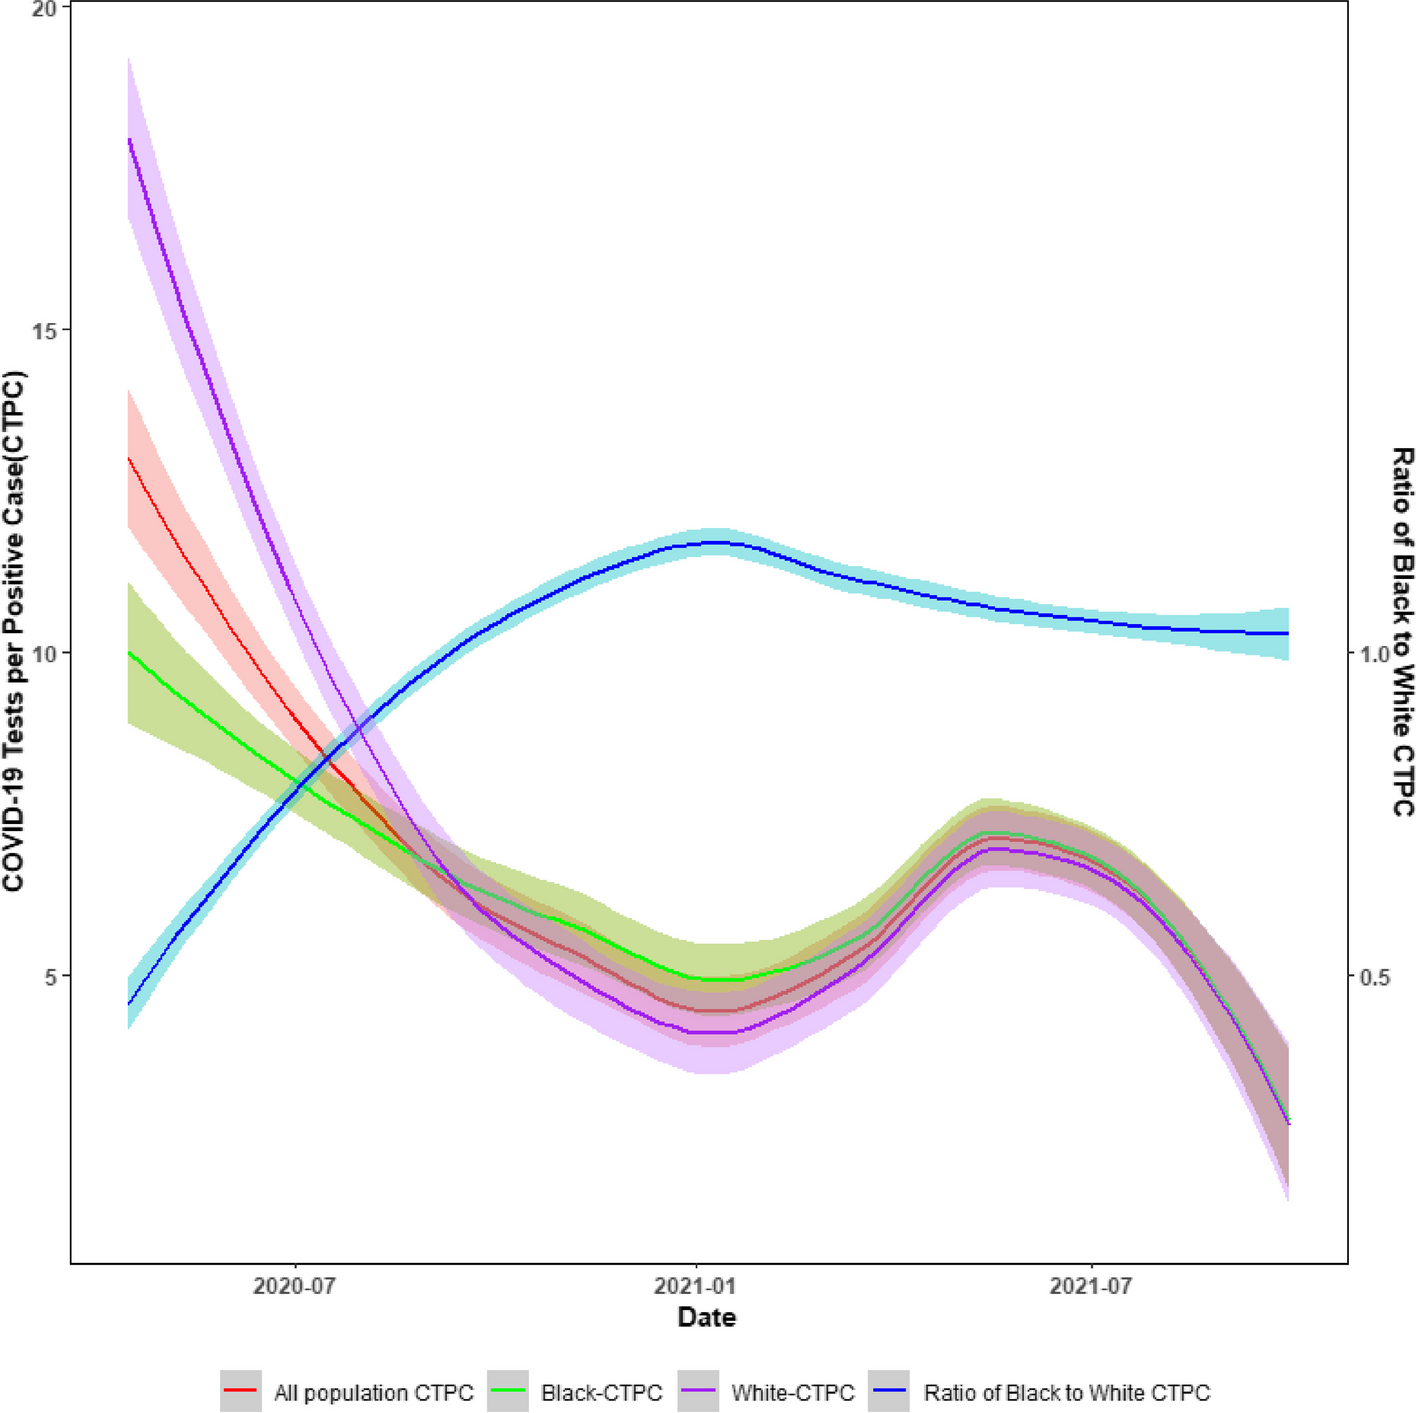
Monthly COVID-19 testing rate per positive case among overall, non-Hispanic Black and non-Hispanic White populations from April 1, 2020, to September 30, 2021, in SC
COVID-19 cripples the restaurant industry as a crucial socioeconomic sector that contributes immensely to the global economy. However, what the current literature less explored is to quantify the effect of COVID-19 on restaurant visitation and revenue at different spatial scales, as well as its relationship with the neighborhood characteristics of customers’ origins. Based on the Point of Interest (POI) measures derived from SafeGraph data providing mobility records of 45 million cell phone users in the US, our study takes Lower Manhattan, New York City, as the pilot study, and aims to examine 1) the change of restaurant visitations and revenue in the period prior to and after the COVID-19 outbreak, 2) the areas where restaurant customers live, and 3) the association between the neighborhood characteristics of these areas and lost customers. By doing so, we provide a geographic information system-based analytical framework integrating the big data mining, web crawling techniques, and spatial-economic modelling. Our analytical framework can be implemented to estimate the broader effect of COVID-19 on other industries and can be augmented in a financially monitoring manner in response to future pandemics or public emergencies.

Top restaurants favored by each county in 2019 and 2020.
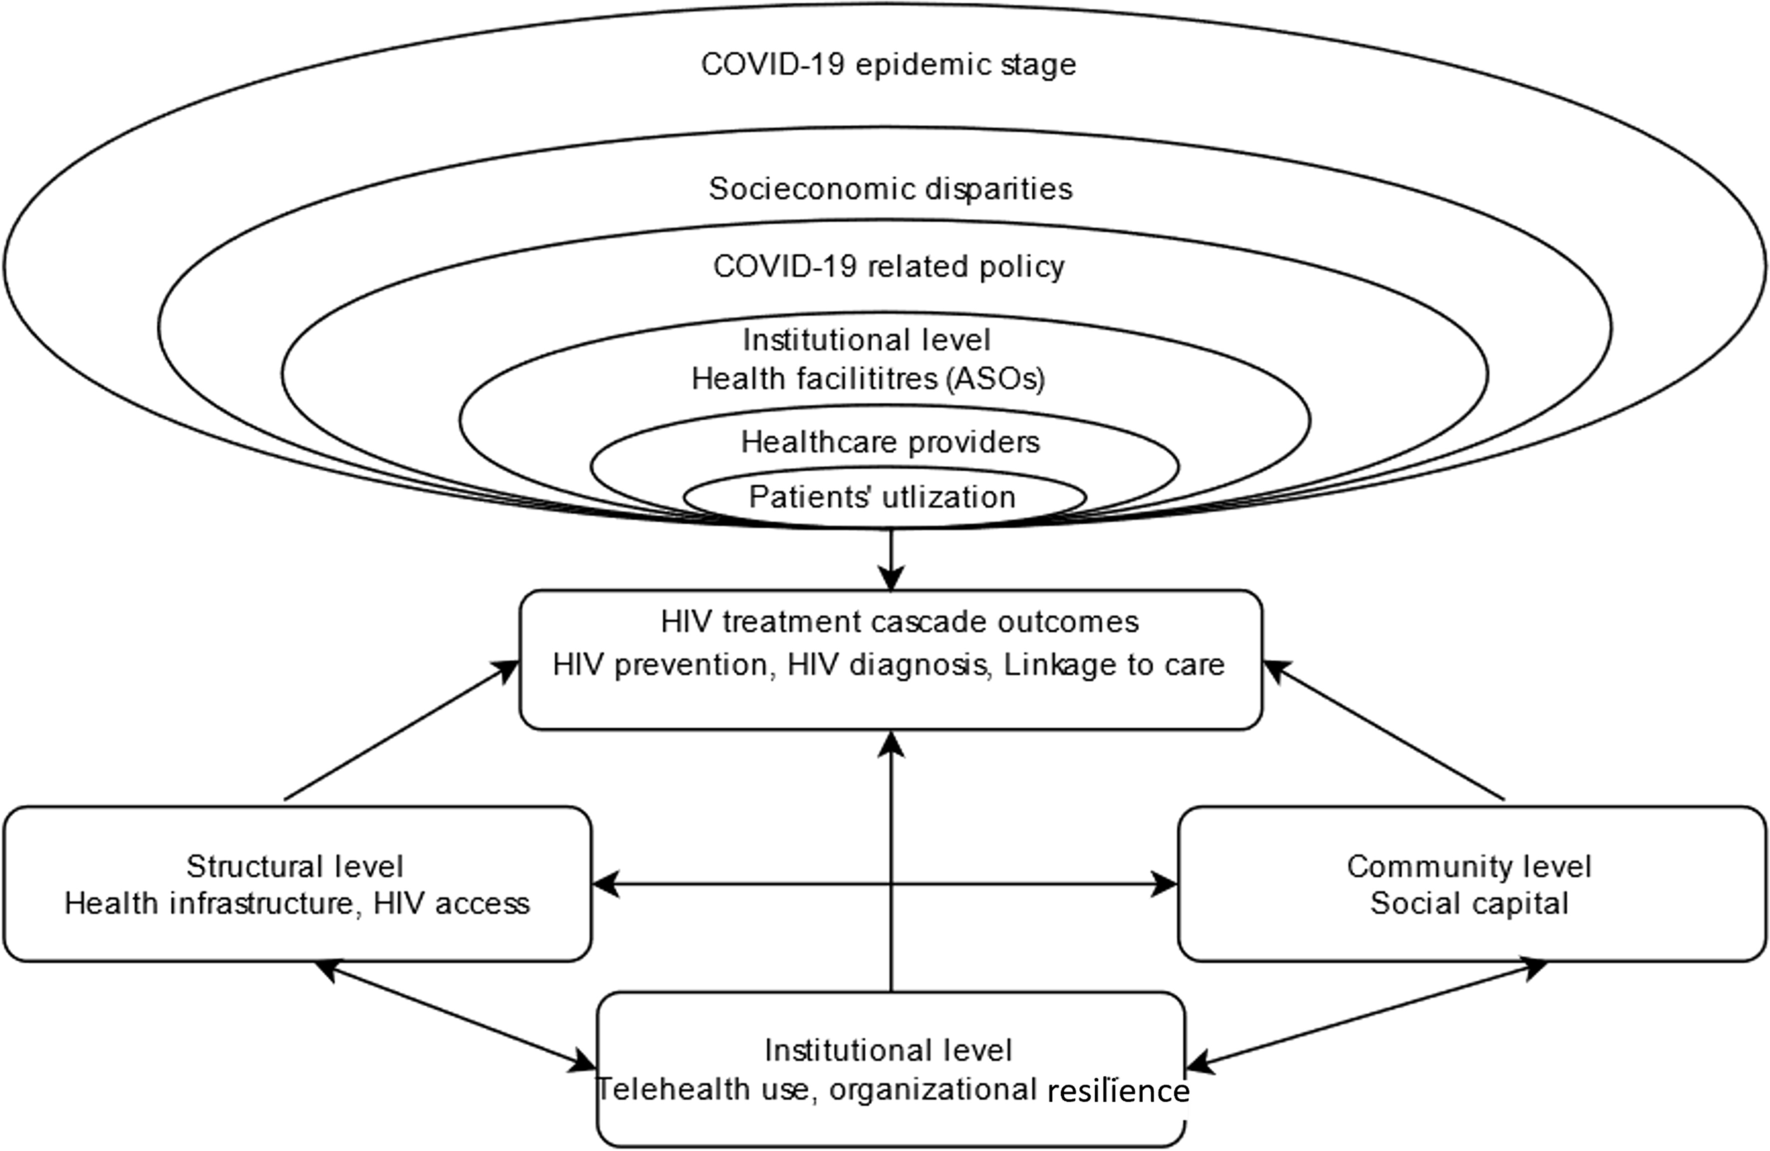
Conceptual framework
Read the full article here.
Although rural communities have been hard-hit by the COVID-19 pandemic, there is limited evidence on COVID-19 outcomes in rural America using up-to-date data. This study aimed to estimate the associations between hospital admissions and mortality and rurality among COVID-19 positive patients who sought hospital care in South Carolina. We used all-payer hospital claims, COVID-19 testing, and vaccination history data from January 2021 to January 2022 in South Carolina. We included 75,545 hospital encounters within 14 days after positive and confirmatory COVID-19 testing. Associations between hospital admissions and mortality and rurality were estimated using multivariable logistic regressions. About 42% of all encounters resulted in an inpatient hospital admission, while hospital-level mortality was 6.3%. Rural residents accounted for 31.0% of all encounters for COVID-19. After controlling for patient-level, hospital, and regional characteristics, rural residents had higher odds of overall hospital mortality (Adjusted Odds Ratio – AOR = 1.19, 95% Confidence Intervals – CI = 1.04–1.37), both as inpatients (AOR = 1.18, 95% CI = 1.05–1.34) and as outpatients (AOR = 1.63, 95% CI = 1.03–2.59). Sensitivity analyses using encounters with COVID-like illness as the primary diagnosis only and encounters from September 2021 and beyond – a period when the Delta variant was dominant and booster vaccination was available – yielded similar estimates. No significant differences were observed in inpatient hospitalizations (AOR = 1.00, 95% CI = 0.75–1.33) between rural and urban residents. Policymakers should consider community-based public health approaches to mitigate geographic disparities in health outcomes among disadvantaged population subgroups.
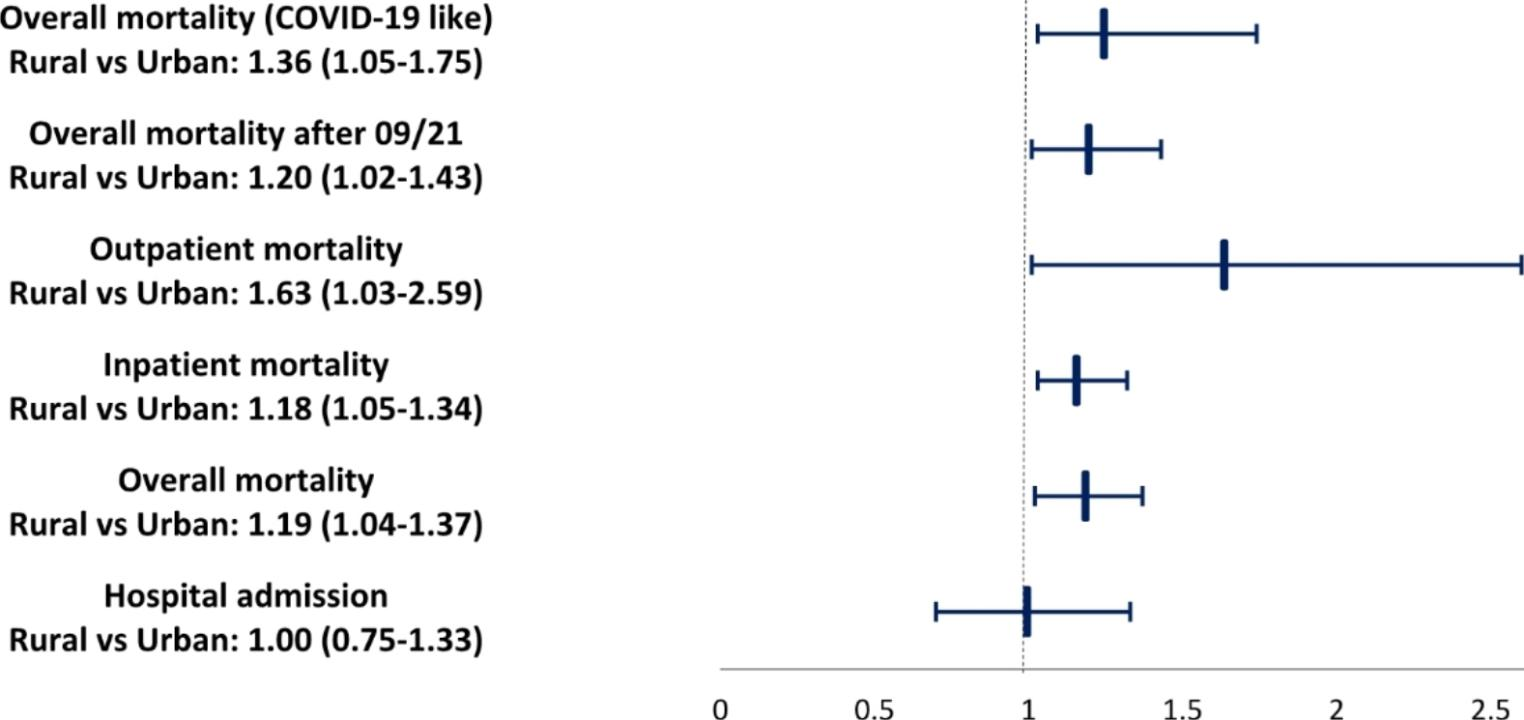
Forest plot showing the adjusted odds ratios for inpatient hospital admissions and mortality among rural versus urban COVID-19 positive patients in South Carolina


Read preprint article here.

Social media mining under the COVID-19 context: Progress, challenges, and opportunities
Abstract: Social media platforms allow users worldwide to create and share information, forging vast sensing networks that allow information on certain topics to be collected, stored, mined, and analyzed in a rapid manner. During the COVID-19 pandemic, extensive social media mining efforts have been undertaken to tackle COVID-19 challenges from various perspectives. This review summarizes the progress of social media data mining studies in the COVID-19 contexts and categorizes them into six major domains, including early warning and detection, human mobility monitoring, communication and information conveying, public attitudes and emotions, infodemic and misinformation, and hatred and violence. We further document essential features of publicly available COVID-19 related social media data archives that will benefit research communities in conducting replicable and reproducible studies. In addition, we discuss seven challenges in social media analytics associated with their potential impacts on derived COVID-19 findings, followed by our visions for the possible paths forward in regard to social media-based COVID-19 investigations. This review serves as a valuable reference that recaps social media mining efforts in COVID-19 related studies and provides future directions along which the information harnessed from social media can be used to address public health emergencies.

Read full article here.
Huang X., Wang S., Zhang M., Hu T., Hohl A., She B., Gong X., Li J., Liu X., Gruebner O.,Liu R., L X., Liu Z., Ye X., Li Z., (2022), Social media mining under the COVID-19 context: progress, challenges, and opportunities, International Journal of Applied Earth Observation and Geoinformation, https://doi.org/10.1016/j.jag.2022.102967
Three dimensions of COVID-19 risk perceptions and their socioeconomic correlates in the United States: A social media analysis
Social media analysis provides an alternate approach to monitoring and understanding risk perceptions regarding COVID-19 over time. Our current understandings of risk perceptions regarding COVID-19 do not disentangle the three dimensions of risk perceptions (perceived susceptibility, perceived severity, and negative emotion) as the pandemic has evolved. Data are also limited regarding the impact of social determinants of health on COVID-19-related risk perceptions over time. To address these knowledge gaps, we extracted tweets regarding COVID-19-related risk perceptions and developed indicators for three dimensions of risk perceptions based on over 502 million geotagged tweets posted by over 4.9 million Twitter users from January 2020 to December 2021 in the United States. We examined correlations between risk perception indicator scores and county-level social determinants of health. The three dimensions of risk perceptions demonstrate different trajectories. Perceived severity maintained a high level throughout the study period. Perceived susceptibility and negative emotion peaked on March 11, 2020 (COVID-19 declared global pandemic by WHO) and then declined and remained stable at lower levels until increasing once again with the Omicron period. Relative frequency of tweet posts on risk perceptions did not closely follow epidemic trends of COVID-19 (cases, deaths). Users from socioeconomically vulnerable counties showed lower attention to perceived severity and susceptibility of COVID-19 than those from wealthier counties. Examining trends in tweets regarding the multiple dimensions of risk perceptions throughout the COVID-19 pandemic can help policymakers frame in-time, tailored, and appropriate responses to prevent viral spread and encourage preventive behavior uptake in the United States.

Qiao S, Li Z, Liang C, Li X, Rudisill AC. (2022) Three dimensions of COVID-19 risk perceptions and their socioeconomic correlates in the United States: A social media analysis. Risk Analysis (in press)
Black businesses matter: A longitudinal study of black-owned restaurants in the COVID-19 pandemic using Geospatial Big Data.
Black communities in the U.S. have been disproportionately affected by the COVID-19 pandemic; however, few empirical studies have been conducted to examine the conditions of Black-owned businesses in the U.S. during this challenging time. In this paper, we assess the circumstances of Black-owned restaurants during the entire year of 2020 through a longitudinal quantitative analysis of restaurant patronage. Using multiple sources of big geospatial data, the analysis reveals that most Black-owned restaurants in the U.S. are negatively impacted by the COVID-19 pandemic among different cities over time. The finding reveals the need for a more in-depth understanding of Black-owned restaurants’ situations during the pandemic and indicates the significance to implement place-based relief strategies for Black-owned restaurants. Our findings also urge big technology companies to improve existing Black owned business campaigns to help them in the long term. This paper implies that GIS development should not be detached from the human experience, especially the experiences of minorities. We call for a humanistic GIS approach to achieve a more racially equitable world.

Huang X., Zhao B., Li Z, Bao S., Zhang S. (2022) Black businesses matter: A longitudinal study of black owned restaurants in the COVID-19 pandemic. Annals of the American Association of Geographers (in press)

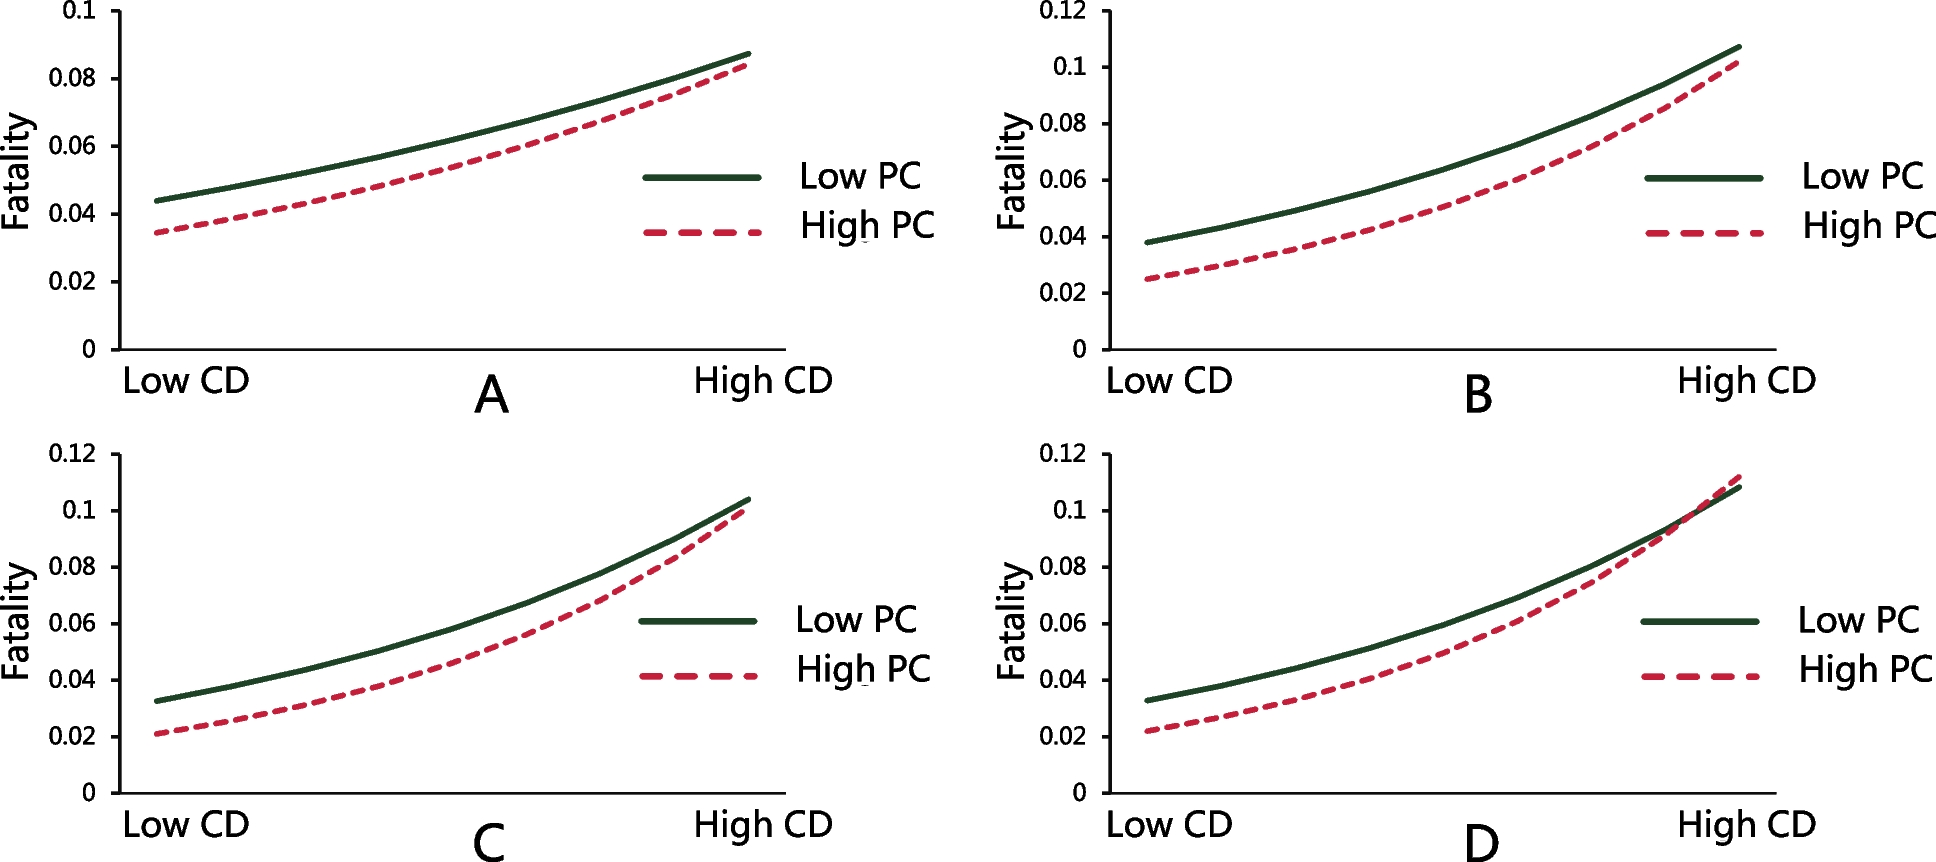
Social capital, urbanization level, and COVID-19 vaccination uptake in the United States: A national level Analysis
Vaccination remains the most promising mitigation strategy for the COVID-19 pandemic. However, existing literature shows significant disparities in vaccination uptake in the United States. Using publicly available national-level data, we aimed to explore if county-level social capital can further explain disparities in vaccination uptake rates when adjusting for demographic and social determinants of health (SDOH) variables, and if association between social capital and vaccination uptake may vary by urbanization level. Bivariate analyses and a hierarchical multivariable quasi-binomial regression analysis were conducted, where the regression analysis was stratified by urban–rural status. The current study suggests that social capital contributes significantly to the disparities of vaccination uptake in the US. The results of the stratification analysis show common predictors of vaccine uptake but also suggest various patterns based on urbanization level regarding the associations of COVID-19 vaccination uptake with SDOH and social capital factors. The study provides a new perspective to address disparities in vaccination uptake through fostering social capital within communities; which may inform tailored public health intervention efforts to enhance social capital and promote vaccination uptake.
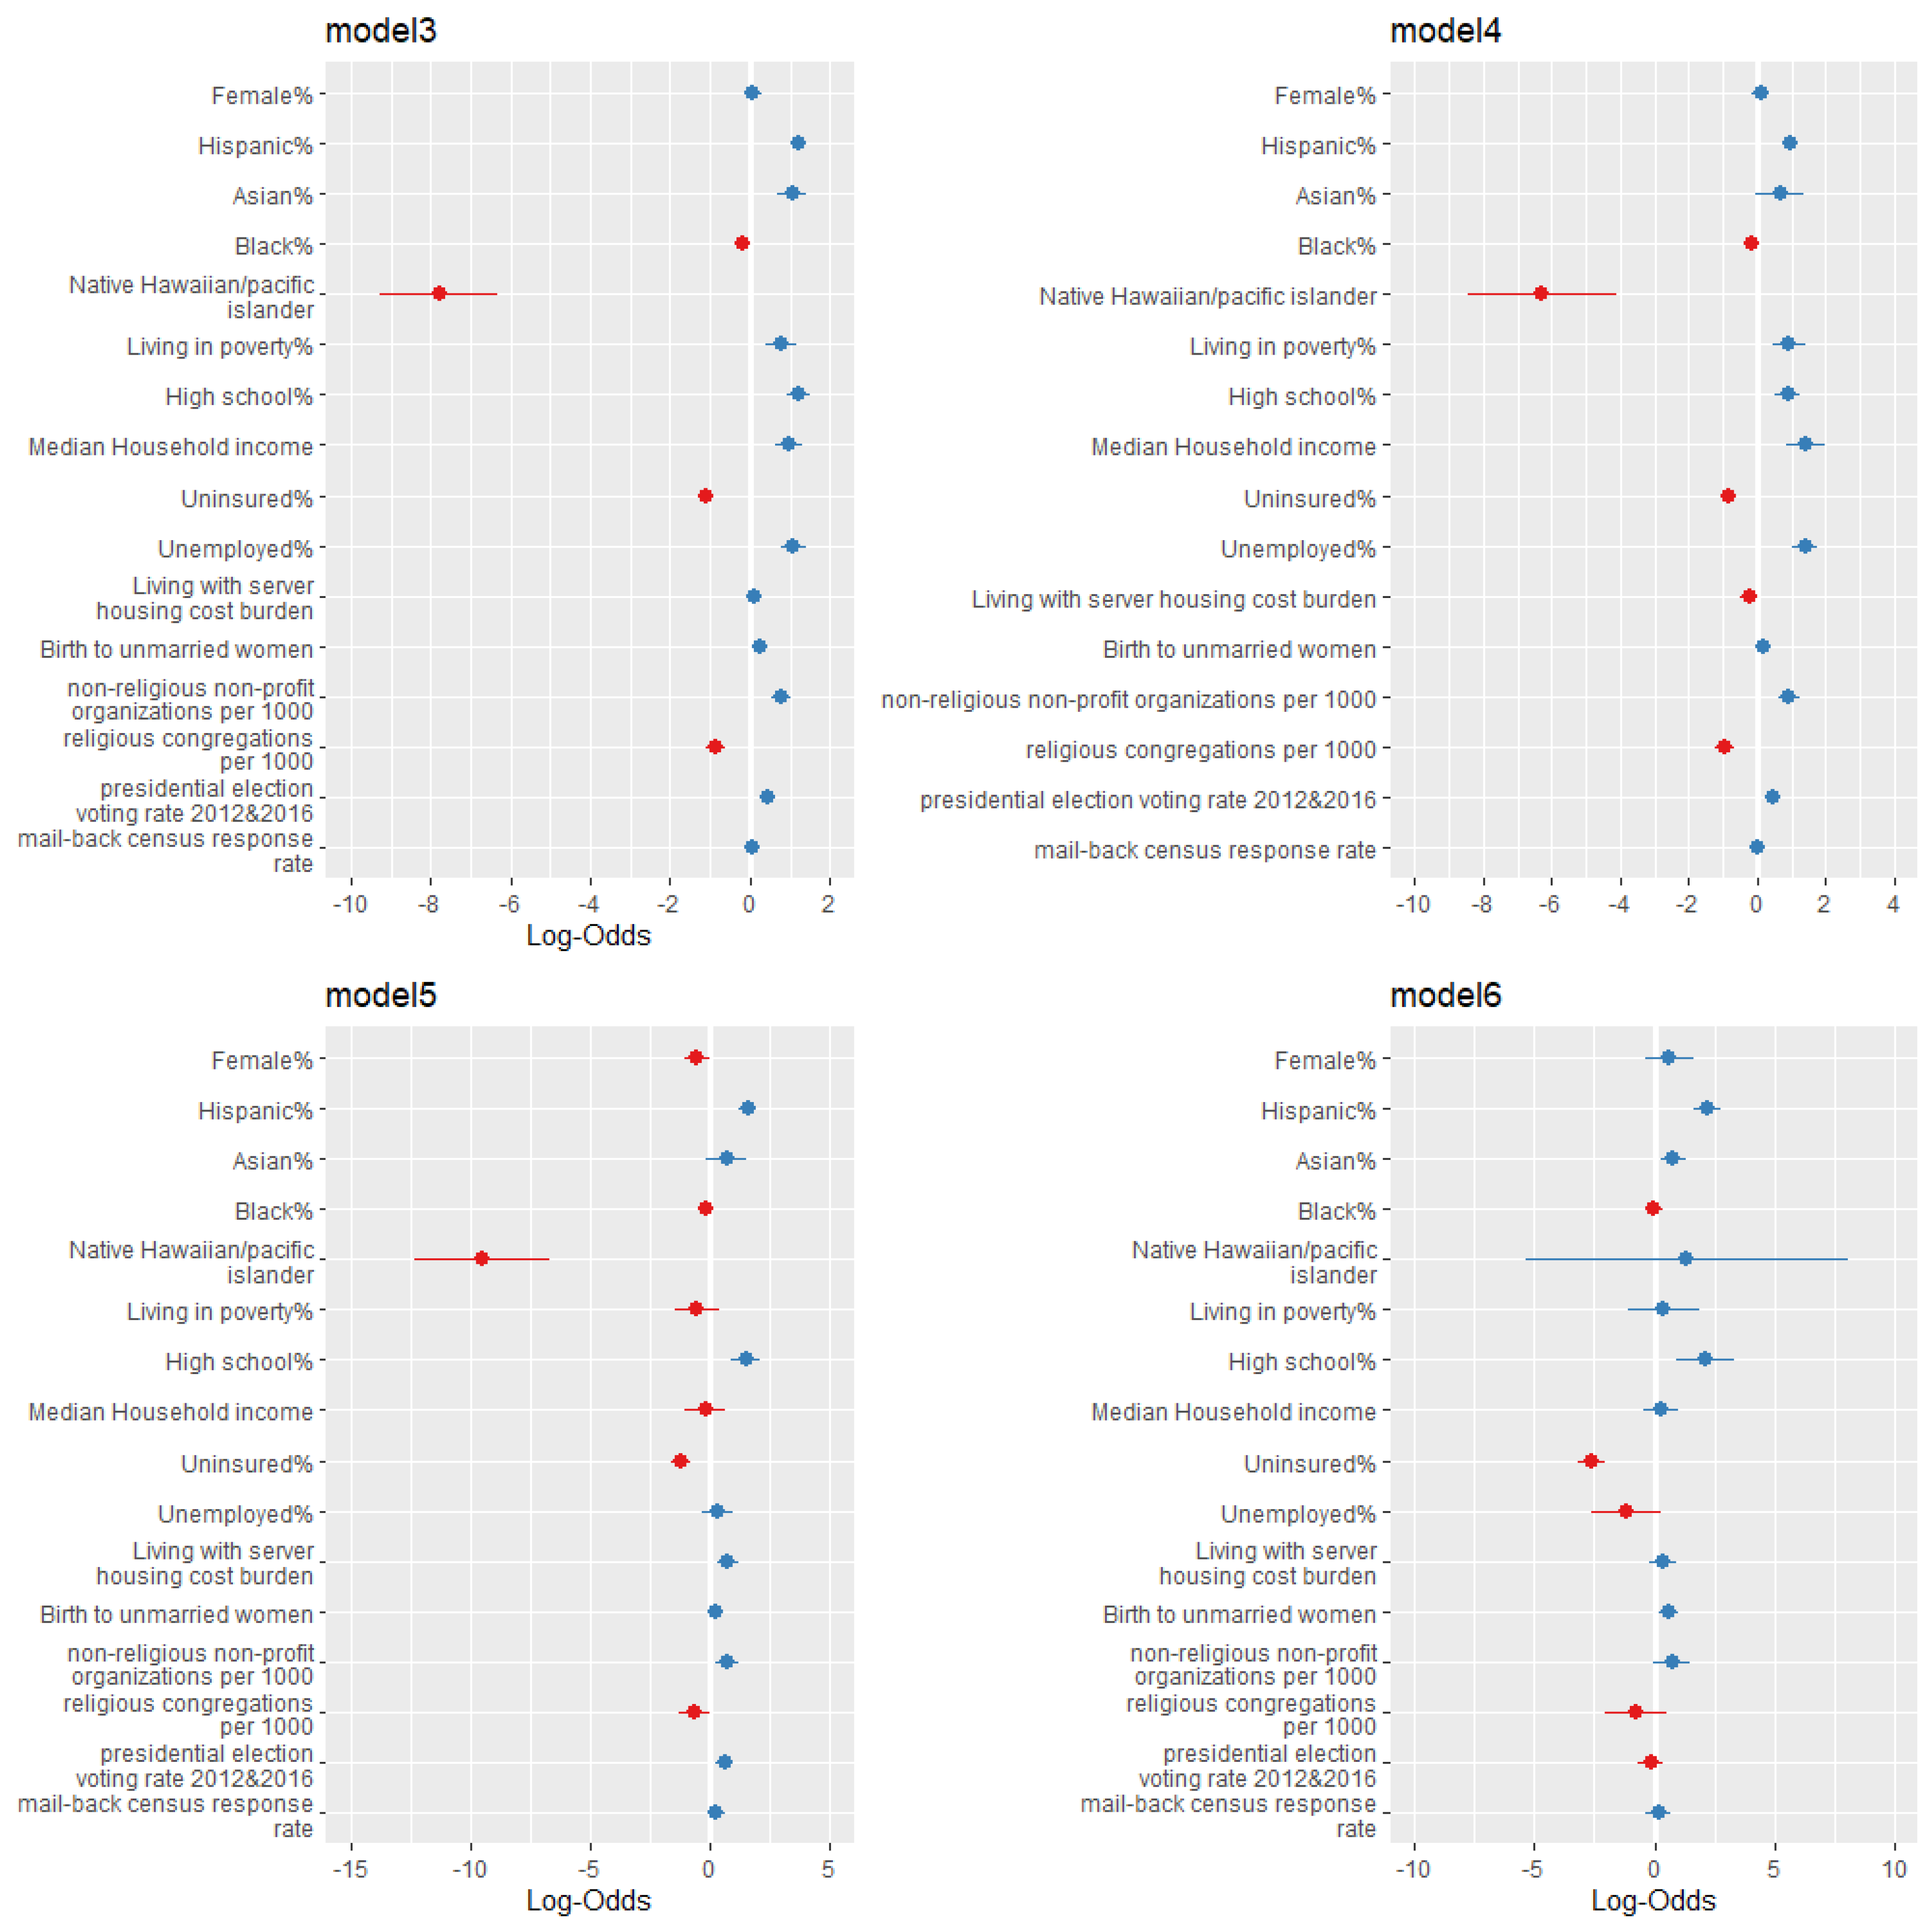
Forest plots of Model 3 to Model 6. Notes: Logarithm of odds ratio was used in developing the forest plots given large value of some odds ratios. We then used zero instead of one as the criteria of significance.
Read full article here.
Human mobility and COVID-19 transmission: a systematic review and future directions
To better understand the role of human mobility in the pandemic, we conducted a systematic review of articles that measure the relationship between human mobility and COVID-19 in terms of their data sources, mathematical models, and key findings. Following the guidelines of the Preferred Reporting Items for Systematic Reviews and Meta-Analyses (PRISMA) statement, we selected 47 articles from the Web of Science Core Collection up to September 2020. Restricting human mobility reduced the transmission of COVID-19, although the effectiveness and stringency of policy implementation vary temporally and spatially across different stages of the pandemic. We call for prompt and sustainable measures to control the pandemic. We also recommend researchers 1) to enhance multi-disciplinary collaboration; 2) to adjust the implementation and stringency of mobility-control policies in corresponding to the rapid change of the pandemic; 3) to improve mathematical models used in analysing, simulating, and predicting the transmission of the disease; and 4) to enrich the source of mobility data to ensure data accuracy and suability.

Summary of mathematical models applied in the selected articles.
Read full article here.
Zhang, M., Wang, S., Hu, T., Fu, X., Wang, X., Hu, Y., Halloran B., Li Z. … & Bao, S. (2022). Human mobility and COVID-19 transmission: A systematic review and future directions. Annals of GIS, 1-14.


Zeng C., Zhang J., Li Z., Sun X., Yang X., Olatosi B., (2022) Weissman S., Li X., Population mobility and aging accelerate the outbreaks of COVID-19 in the Deep South: a county-level longitudinal analysis, Clinical Infectious Diseases (in press)


The times, they are a-changin’: tracking the shifts in mental health signals in Australia from the early to later phase of the COVID-19 pandemic
Widespread problems of psychological distress have been observed in many countries following the outbreak of COVID-19, including Australia. What is lacking from current scholarship is a national-scale assessment that tracks the shifts in mental health during the pandemic timeline and across geographic contexts. We set out a novel empirical framework using social media to systematically classify, measure, map, and track the mental health of a nation. Our approach is designed in a manner that can readily be augmented into an ongoing monitoring capacity and extended to other nations. Tracking locales where people are displaying elevated levels of pessimistic mental health signals provide important information for the smart deployment of finite mental health services. This is especially critical in a time of crisis during which resources are stretched beyond normal bounds.

Wang S., Huang X., Hu T., Zhang M., Li Z., Ning H., et al., (2021). The times, they are a-changin’: tracking the shifts in mental health signals in Australia from the early to later phase of the COVID-19 pandemic, BMJ Global Health (in press)
Exploring the spatial disparity of home-dwelling time patterns in the U.S. during the COVID-19 pandemic via Bayesian inference
In this study, we aim to reveal hidden patterns and confounders associated with policy implementation and adherence by investigating the home-dwelling stages from a data-driven perspective via Bayesian Inference with weakly informative priors and by examining how home-dwelling stages in the U.S. varied geographically, using fine-grained, spatial-explicit home-dwelling time records from a multi-scale perspective. At the U.S. national level, two changepoints are identified, with the former corresponding to March 22, 2020 (nine days after the White House declared the National Emergency on March 13) and the latter corresponding to May 17, 2020. Inspections on the U.S. state and county level reveal notable spatial disparity in home-dwelling stages, presumably resulting from the discrepancies in political partisanship, COVID-19 severity, social distancing compliance, re-opening policy, and industry distribution. A pilot study in the Atlanta Metropolitan area at the Census Tract level reveals that the self-quarantine duration and increase in home-dwelling time are strongly correlated with the median household income, echoing existing efforts that document the economic inequity exposed by the U.S. stay-at-home orders. To our best knowledge, our work marks a pioneering effort to explore multi-scale home-dwelling patterns in the U.S. from a pure data-driven perspective and in a statistically robust manner.
Read full article here.

Huang X., Xu Y., Liu R., Wang S., Wang S., Zhang M., Kang Y. Zhang Z., Gao S., Li Z., Hu T. (2021), Exploring the spatial disparity of home-dwelling time patterns in the U.S. during the COVID-19 pandemic via Bayesian inference, Transactions in GIS
The promise of excess mobility analysis: measuring episodic-mobility with geotagged social media data
Human mobility studies have become increasingly important and diverse in the past decade with the support of social media big data that enables human mobility to be measured in a harmonized and rapid manner. However, what is less explored in the current scholarship is episodic mobility as a special type of human mobility defined as the abnormal mobility triggered by episodic events excess to the normal range of mobility at large. Drawing on a large-scale systematic collection of 1.9 billion geotagged Twitter data from 2017 to 2020, this study contributes the first empirical study of episodic mobility by producing a daily Twitter census of visitors at the U.S. county level and proposing multiple statistical approaches to identify and quantify episodic mobility. It is followed by four case studies of episodic mobility in U.S. national wide to showcase the great potential of Twitter data and our proposed method to detect episodic mobility subject to episodic events that occur both regularly and sporadically. This study provides new insights on episodic mobility in terms of its conceptual and methodological framework and empirical knowledge, which enriches the current mobility research paradigm.
Read full article here.

Temporal Geospatial Analysis of COVID-19 Pre-Infection Determinants of Risk in South Carolina
Disparities and their geospatial patterns exist in morbidity and mortality of COVID-19 patients. When it comes to the infection rate, there is a dearth of research with respect to the disparity structure, its geospatial characteristics, and the pre-infection determinants of risk (PIDRs). This work aimed to assess the temporal–geospatial associations between PIDRs and COVID-19 infection at the county level in South Carolina. We used the spatial error model (SEM), spatial lag model (SLM), and conditional autoregressive model (CAR) as global models and the geographically weighted regression model (GWR) as a local model. The data were retrieved from multiple sources including USAFacts, U.S. Census Bureau, and the Population Estimates Program. The percentage of males and the unemployed population were positively associated with geodistributions of COVID-19 infection (p values < 0.05) in global models throughout the time. The percentage of the white population and the obesity rate showed divergent spatial correlations at different times of the pandemic. GWR models fit better than global models, suggesting nonstationary correlations between a region and its neighbors. Characterized by temporal–geospatial patterns, disparities in COVID-19 infection rate and their PIDRs are different from the mortality and morbidity of COVID-19 patients. Our findings suggest the importance of prioritizing different populations and developing tailored interventions at different times of the pandemic.
Read full article here.

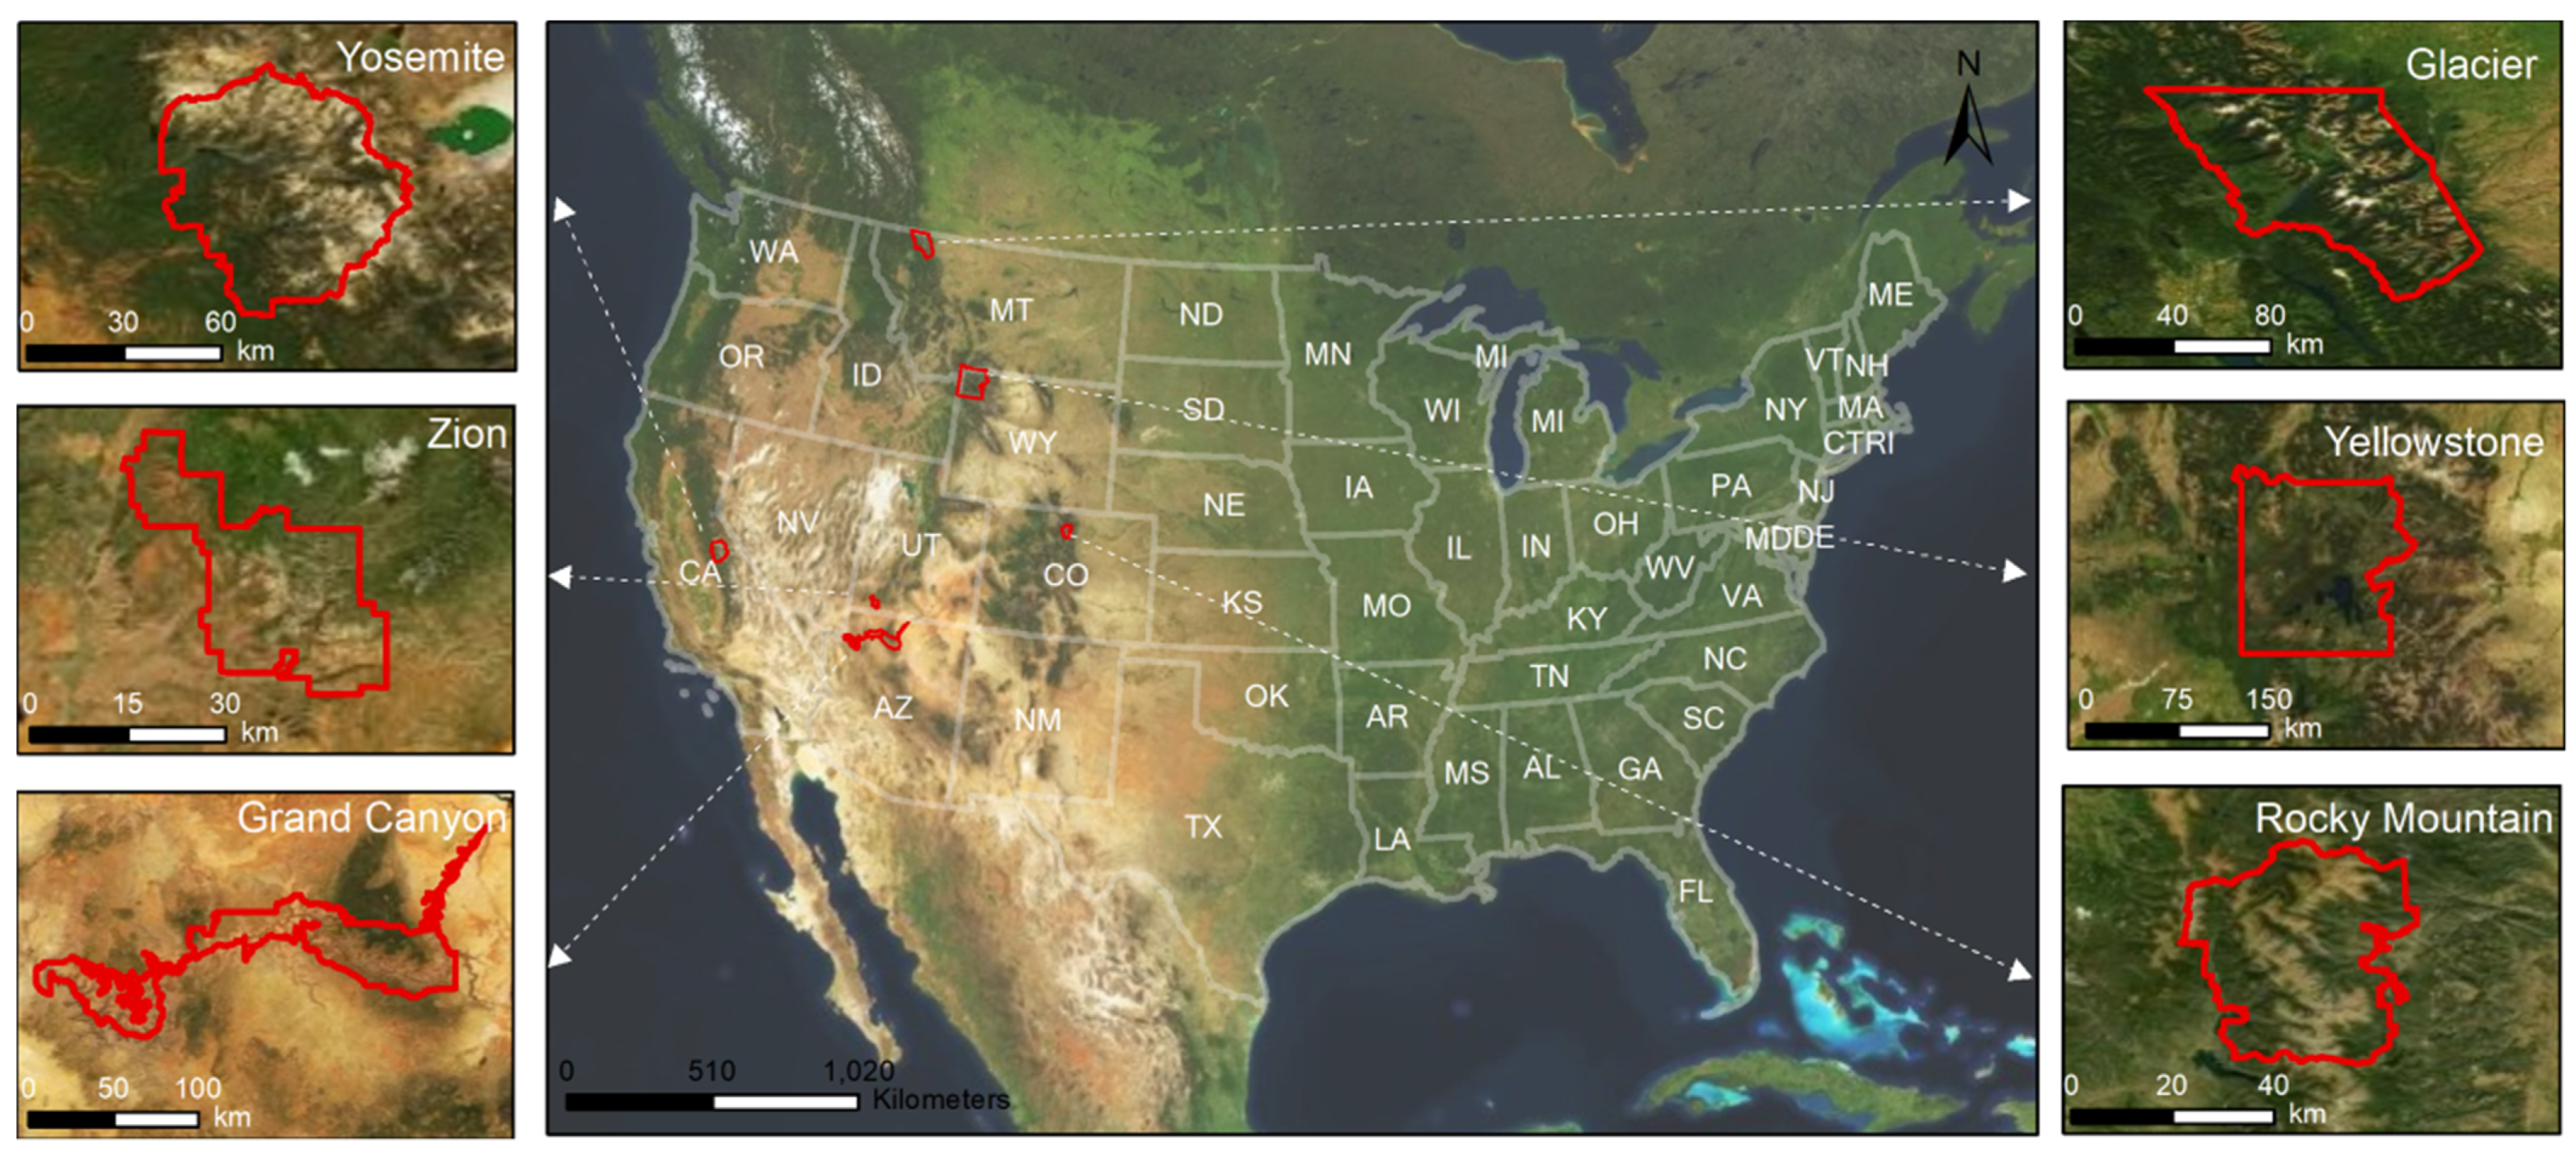
Using Mobile Device Data to Track the Effects of the COVID-19 Pandemic on Spatiotemporal Patterns of National Park Visitation
Effective quantification of visitation is important for understanding many impacts of the COVID-19 pandemic on national parks and other protected areas. In this study, we mapped and analyzed the spatiotemporal patterns of visitation for six national parks in the western U.S., taking advantage of large mobility records sampled from mobile devices and released by SafeGraph as part of their Social Distancing Metric dataset. Based on comparisons with visitation statistics released by the U.S. National Park Service, our results confirmed that mobility records from digital devices can effectively capture park visitation patterns but with much finer spatiotemporal granularity. In general, triggers of visitation changes corresponded well with the parks’ management responses to COVID-19, with all six parks showing dramatic decreases in the number of visitors (compared to 2019) beginning in March 2020 and continuing through April and May. As restrictions were eased to promote access to the parks and the benefits associated with outdoor recreation, visitation in 2020 approached or even passed that from 2019 by late summer or early autumn at most of the parks. The results also revealed that parks initially saw the greatest increases in visitation after reopening originating from nearby states, with visitorship coming from a broader range of states as time passed. Our study highlights the capability of mobility data for providing spatiotemporally explicit knowledge of place visitation.
Read the full article here.
Revealing public opinion towards COVID-19 vaccines with Twitter data in the United States: a spatiotemporal perspective
The COVID-19 pandemic has imposed a large, initially uncontrollable, public health crisis both in the US and across the world, with experts looking to vaccines as the ultimate mechanism of defense. The development and deployment of COVID-19 vaccines have been rapidly advancing via global efforts. Hence, it is crucial for governments, public health officials, and policymakers to understand public attitudes and opinions towards vaccines, such that effective interventions and educational campaigns can be designed to promote vaccine acceptance. The aim of this study is to investigate public opinion and perception on COVID-19vaccines by investigating the spatiotemporal trends of their sentiment and emotion towards vaccines, as well as how such trends relate to popular topics on Twitter in the US.
Read preprint article here.

Spatiotemporal Patterns of Human Mobility and Its Association with Land Use Types during COVID-19 in New York City
This study uses geotagged tweets data to reveal the spatiotemporal human mobility patterns during this COVID-19 pandemic in New York City. With New York City open data, human mobility pattern changes were detected by different categories of land use, including residential, parks, transportation facilities, and workplaces. This study further compares human mobility patterns by land use types based on an open social media platform (Twitter) and the human mobility patterns revealed by Google Community Mobility Report cell phone location, indicating that in some applications, open-access social media data can generate similar results to private data. The results of this study can be further used for human mobility analysis and the battle against COVID-19.
Read the full paper here.

ODT FLOW: A Scalable Platform for Extracting, Analyzing, and Sharing Multi-source Multi-scale Human Mobility
In response to the soaring needs of human mobility data, especially during disaster events such as the COVID-19 pandemic, and the associated big data challenges, we develop a scalable online platform for extracting, analyzing, and sharing multi-source multi-scale human mobility flows. Within the platform, an origin-destination-time (ODT) data model is designed to work with scalable query engines to handle heterogenous mobility data in large volumes with extensive spatial coverage, which allows for efficient extraction, query, and aggregation of billion-level origin-destination (OD) flows in parallel at the server-side. An interactive spatial web portal, ODT Flow Explorer, is developed to allow users to explore multi-source mobility datasets with user-defined spatiotemporal scales. To promote reproducibility and replicability, we further develop ODT Flow REST APIs that provide researchers with the flexibility to access the data programmatically via workflows, codes, and programs. Demonstrations are provided to illustrate the potential of the APIs when it is integrated with scientific workflows and with the Jupyter Notebook environment. We believe the platform can assist human mobility monitoring and analysis during disaster events such as the ongoing COVID-19 pandemic and benefit both scientific communities and the general public in understanding human mobility dynamics.
Explore, visualize, and download the ODT flow data using the ODT Flow Explorer: http://gis.cas.sc.edu/GeoAnalytics/od.html
Access the ODT flow data programmatically using the ODT Flow REST APIs with Jupyter Notebook: https://github.com/GIBDUSC/ODT_Flows/blob/main/ODT%20Flow%20REST%20APIs_Notebook_Tutorial.ipynb
Case studies of accessing the ODT flow data in the KNIME workflow computing environment: https://github.com/GIBDUSC/ODT_Flow/tree/main/KNIME%20workflow%20case%20studies
Video Tutorial for the ODT Flow Explorer: https://www.youtube.com/watch?v=lV3AJIVYnSI
Learn more about the system at: https://www.researchgate.net/publication/350342301_ODT_FLOW_A_Scalable_Platform_for_Extracting_Analyzing_and_Sharing_Multi-source_Multi-scale_Human_Mobility_Flows

Spatial-temporal relationship between population mobility and COVID-19 outbreaks in South Carolina: A time series forecasting analysis
Objective To examine the spatial-temporal relationship between population mobility and COVID-19 outbreaks and use population mobility to predict daily new cases at both state- and county- levels in SC.
Methods This longitudinal study used disease surveillance data and Twitter-based population mobility data from March 6 to November 11, 2020 in SC and its top five counties with the largest number of cumulative confirmed cases. Daily new case was calculated by subtracting the cumulative confirmed cases of previous day from the total cases. Population mobility was assessed using the number of users with travel distance larger than 0.5 mile which was calculated based on their geotagged twitters. Poisson count time series model was employed to carry out the research goals.
Results Population mobility was positively associated with state-level daily COVID-19 incidence and those of the top five counties (i.e., Charleston, Greenville, Horry, Spartanburg, Richland). At the state-level, final model with time window within the last 7-day had the smallest prediction error, and the prediction accuracy was as high as 98.7%, 90.9%, and 81.6% for the next 3-, 7-, 14- days, respectively. Among Charleston, Greenville, Horry, Spartanburg, and Richland counties, the best predictive models were established based on their observations in the last 9-, 14-, 28-, 20-, and 9- days, respectively. The 14-day prediction accuracy ranged from 60.3% to 74.5%.
Conclusions Population mobility was positively associated with COVID-19 incidences at both state- and county- levels in SC. Using Twitter-based mobility data could provide acceptable prediction for COVID-19 daily new cases. Population mobility measured via social media platform could inform proactive measures and resource relocations to curb disease outbreaks and their negative influences.

Read the preprint article here. The paper has been accepted by the Journal of Medical Internet Research.
Measuring Global Multi-Scale Place Connectivity using Geotagged Social Media Data
Shaped by human movement, place connectivity is quantified by the strength of spatial interactions among locations. For decades, spatial scientists have researched place connectivity, applications, and metrics. The growing popularity of social media provides a new data stream where spatial social interaction measures are largely devoid of privacy issues, easily assessable, and harmonized. In this study, we introduced a global multi-scale place connectivity index (PCI) based on spatial interactions among places revealed by geotagged tweets as a spatiotemporal-continuous and easy-to-implement measurement. The multi-scale PCI, demonstrated at the US county level, exhibits a strong positive association with SafeGraph population movement records (10% penetration in the US population) and Facebook’s social connectedness index (SCI), a popular connectivity index based on social networks. We found that PCI has a strong boundary effect and that it generally follows the distance decay, although this force is weaker in more urbanized counties with a denser population. Our investigation further suggests that PCI has great potential in addressing real-world problems that require place connectivity knowledge, exemplified with two applications: 1) modeling the spatial spread of COVID-19 during the early stage of the pandemic and 2) modeling hurricane evacuation destination choice. The methodological and contextual knowledge of PCI, together with the launched visualization platform and open-sourced PCI datasets at various geographic levels, are expected to support research fields requiring knowledge in human spatial interactions.
The interactive web portal for visualizing the PCI and relevant datasets can be accessed at http://gis.cas.sc.edu/GeoAnalytics/pci.html.
Download PCI and relevant datasets at https://github.com/GIBDUSC/Place-Connectivity-Index


Background and Objective: Human movement is one of the forces that drive the spatial spread of infectious diseases. To date, reducing and tracking human movement during the COVID-19 pandemic has proven effective in limiting the spread of the virus. Existing methods for monitoring and modeling the spatial spread of infectious diseases rely on various data sources as proxies of human movement, such as airline travel data, mobile phone data, and banknote tracking. However, intrinsic limitations of these data sources prevent us from systematic monitoring and analyses of human movement on different spatial scales (from local to global). Big data from social media such as geotagged tweets have been widely used in human mobility studies, yet more research is needed to validate the capabilities and limitations of using such data for studying human movement at different geographic scales (eg, from local to global) in the context of global infectious disease transmission. This study aims to develop a novel data-driven public health approach using big data from Twitter coupled with other human mobility data sources and artificial intelligence to monitor and analyze human movement at different spatial scales (from global to regional to local).

Learn more about the mobility datasets and the web portal at http://gis.cas.sc.edu/gibd/odt-flow-explorer-query-visualize-and-download-population-movement-data.
Try the web portal here: http://gis.cas.sc.edu/GeoAnalytics/od.htm

Towards real-time population estimates: introducing Twitter daily estimates of residents and non-residents at the county level
The study of migrations and mobility has historically been severely limited by the absence of reliable data or the temporal sparsity of the available data. Using geospatial digital trace data, the study of population movements can be much more precisely and dynamically measured. Our research seeks to develop a near real-time (one-day lag) Twitter census that gives a more temporally granular picture of local and non-local population at the county level. Leveraging geotagged tweets to determine the home location of all active Twitter users, we contribute to the field of digital and computational demography by obtaining accurate daily Twitter population stocks (residents and non-residents). Internal validation reveals over 80% of accuracy when compared with users self-reported home location. External validation results suggest these stocks correlate with available statistics of residents/non-residents at the county level and can accurately reflect regular (seasonal tourism) and non-regular events such as the Great American Solar Eclipse of 2017. The findings demonstrate that Twitter holds potential to introduce the dynamic component often lacking in population estimates for the understanding of human spatial behavior under normal and extraordinary conditions such as the COVID-19 global crisis.

Time-series clustering for home dwell time during COVID-19: what can we learn from it?
In this study, we investigate the potential driving factors that lead to the disparity in the time-series of home dwell time, aiming to provide fundamental knowledge that benefits policy-making for better mitigation strategies of future pandemics. Taking Metro Atlanta as a study case, we perform a trend-driven analysis by conducting Kmeans time-series clustering using fine-grained home dwell time records from SafeGraph, and further assess the statistical significance of sixteen demographic/socioeconomic variables from five major categories. We find that demographic/socioeconomic variables can explain the disparity in home dwell time in response to the stay-at-home order, which potentially leads to disparate exposures to the risk from the COVID-19. The results further suggest that socially disadvantaged groups are less likely to follow the order to stay at home, pointing out the extensive gaps in the effectiveness of social distancing measures exist between socially disadvantaged groups and others. Our study reveals that the long-standing inequity issue in the U.S. stands in the way of the effective implementation of social distancing measures. Policymakers need to carefully evaluate the inevitable trade-off among different groups, making sure the outcomes of their policies reflect interests of the socially disadvantaged groups.

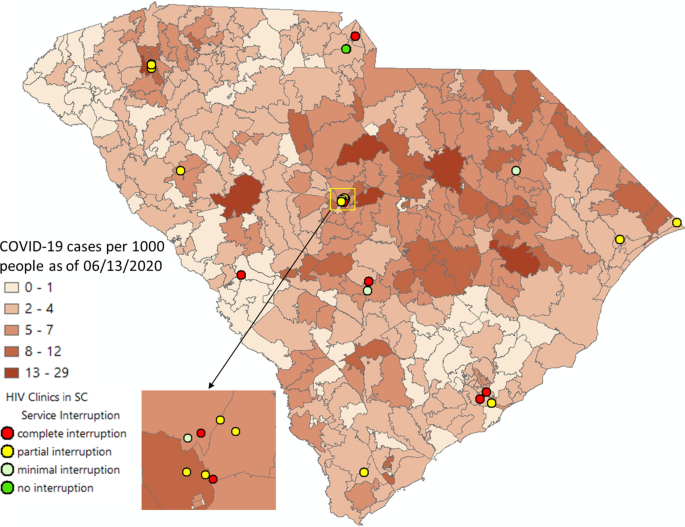
Understanding the Disparity in HIV Service Interruption in the Outbreak of COVID-19 in South Carolina
To examine HIV service interruptions during the COIVD-19 outbreak in South Carolina (SC) and identify geospatial and socioeconomic correlates of such interruptions, we collected qualitative, geospatial, and quantitative data from 27 Ryan White HIV clinics in SC in March, 2020. HIV service interruptions were categorized (none, minimal, partial, and complete interruption) and analyzed for geospatial heterogeneity. Nearly 56% of the HIV clinics were partially interrupted and 26% were completely closed. Geospatial heterogeneity of service interruption existed but did not exactly overlap with the geospatial pattern of COVID-19 outbreak. The percentage of uninsured in the service catchment areas was significantly correlated with HIV service interruption (F = 3.987, P = .02). This mixed-method study demonstrated the disparity of HIV service interruptions in the COVID-19 in SC and suggested a contribution of existing socioeconomic gaps to this disparity. These findings may inform the resources allocation and future strategies to respond to public health emergencies.
Analyzing the characteristics of multi-source mobility datasets and how they reveal the luxury nature of social distancing in the U.S. during the COVID-19 pandemic
This study reveals the human mobility from various sources and the luxury nature of social distancing in the U.S during the COVID-19 pandemic by highlighting the disparities in mobility dynamics from lower-income and upper-income counties. We collect, process, and compute mobility data from four sources: 1) Apple mobility trend reports, 2) Google community mobility reports, 3) mobility data from Descartes Labs, and 4) Twitter mobility calculated via weighted distance. We find statistically significant positive correlations in the between either two data sources, revealing their general similarity, albeit with varying Pearson’s coefficients. Despite the similarity, however, mobility from each source presents unique and even contrasting characteristics, in part demonstrating the multifaceted nature of human mobility. The positive correlation between RI and income at the county level is significant in all mobility datasets, suggesting that counties with higher income tend to react more aggressively in terms of reducing more mobility in response to the COVID-19 pandemic. Most states present a positive difference in between their upper-income and lower-income counties, where diverging patterns in time series of mobility changes percentages can be found. To our best knowledge, this is the first study that cross-compares multi-source mobility datasets. The findings shed light on not only the characteristics of multi-source mobility data but also the mobility patterns in tandem with the economic disparity.

We invite submissions to the Special Issue “GIScience for Risk Management in Big Data Era” by ISPRS International Journal of Geo-Information
This Special Issue aims to capture recent efforts and advancements in harnessing the power of GIScience for risk management in the big data era.
The first group of possible topics is to inspire potential authors to deal with basic and new trends related to the big data era. The contribution of novel approaches to spatial data collection (social networks, sensors, citizen science, VGI, etc.), disaster big data processing and sharing, real-time data-centric intelligence based on sensors, harmonization of heterogeneous data into a single structure, cybersecurity of geographical information systems and others, is welcomed, along with analyses and commentary.
The second thematic block will cover cartography and GIS theories such as mobile disaster cartography, concepts, ontologization and standardization, cross-cultural aspects of disaster cartography, investigation of the psychological condition of end-users given by their personal character and situation, and the psychological condition of rescued persons are offered together with questions that are still open on the mapping methodologies and technologies for EW&CM from children and senior perspectives.
The third group of topics aims to address mapping and visualization techniques. Dynamic and real-time cartographic visualization concepts and techniques for enhanced operational activities for selected EW, DRM, and DRR purposes are highlighted. Included in the same group are both virtual environments for EW, DRM, and DRR as well as 3D analysis and visualization of disaster events.
The last group of topics is devoted to services and applications, and may include analyses and descriptions of location-based services for emergencies (web services, etc.), multimodal emergency positioning, mapping based on social big data, internet of things for solutions and visualizations, and disaster chain modeling.
Human Mobility, Policy, and COVID-19: A Preliminary Analysis of South Carolina
Using geotagged Twitter data as the mobility data source and South Carolina as the case study, we present some preliminary findings and visualizations on population flows and human mobility changes during the pandemic at state level and county level. The potential associations between human mobility, state policies, and COVID-19 cases are also examined.

Figure 4. Daily new cases and human mobility in South Carolina
How our collective efforts of fighting COVID-19 are reflected on maps?

Check out our new preprint “Twitter, human mobility, and COVID-19”
The outbreak of COVID-19 is a public health pandemic that raises wide concerns worldwide, leading to serious health, economic, and social challenges. The rapid spread of the virus at a global scale highlights the need for a more harmonized, less privacy-concerning, easily accessible approach to monitoring the human mobility that has been proved to be associated with the viral transmission. In this study, we analyzed 587 million tweets worldwide to see how global collaborative efforts in reducing human mobility are reflected from the user-generated information at the global, country, and the U.S. state scale. Considering the multifaceted nature of mobility, we propose two types of distance: the single-day distance and the cross-day distance. To quantify the responsiveness in certain geographic regions, we further propose a mobility-based responsive index (MRI) that captures the overall degree of mobility changes within a time window. The results suggest that mobility patterns obtained from Twitter data are amendable to quantitatively reflect the mobility dynamics. Globally, the proposed two distances had greatly deviated from their baselines after March 11, 2020 when WHO declared COVID-19 as a pandemic. The considerably less periodicity after the declaration suggests that the protection measures have obviously affected people’s travel routines. The country scale comparisons reveal the discrepancies in responsiveness, evidenced by the contrasting mobility patterns in different epidemic phases. We find that the triggers of mobility changes correspond well with the national announcements of mitigation measures, proving that Twitter-based mobility implies the effectiveness of those measures. In the U.S., the influence of the COVID-19 pandemic on mobility is distinct. However, the impacts varied substantially among states. The strong mobility recovering momentum is further fueled by the Black Lives Matter protests, potentially fostering the second wave of infections in the U.S.

Zhenlong Li will be presenting a public webinar as a part of the @UofSC_CAS summer webinar series on July 28

UofSC Big Data Health Science Center investigators receive $1.25 million NIH grant to develop data-driven strategies in fighting COVID-19
Xiaoming Li (Department of Health Promotion, Education, and Behavior, Arnold School of Public Health) and Bankole Olatosi(Department of Health Services Policy and Management, Arnold School of Public Health), in collaboration with BDHSC faculty members from the Arnold School of Public Health (Jiajia Zhang), College of Arts and Sciences (Zhenlong Li), College of Engineering and Computing (Neset Hikmetand Jianjun Hu), and School of Medicine-Columbia (Sharon Weissman), have been awarded a $1,252,550 grant from the National Institute of Allergy and Infectious Diseases to develop a state-wide data-driven system to fight COVID-19 in South Carolina.
In the news: Twitter could help predict future outbreaks
The places people tweet could help predict a future pandemic thanks to the work of three University of South Carolina professors.
Zhenlong Li, a geography professor in the College of Arts and Sciences, and two Arnold School of Public Health professors, Dwyane Porter and Xiaoming Li, are studying the spread of the COVID-19 outbreak along with Twitter data that shows human movement patterns. They hope to develop a model that improves understanding about the current outbreak and could help fight future pandemics. In May, the National Science Foundation boosted their work with a $108,717 grant….
We received NSF RAPID Award to conduct COVID-19 research
Dr. Zhenlong Li, in collaboration with two of his public health colleagues, Dr. Dwayne Porter and Dr. Xiaoming Li, received an NSF award titled “Monitoring the Spatial Spread of COVID-19 through the Lens of Human Movement using Big Social Media Data“.
This project aims to provide enhanced situation awareness and offer valuable contributions to building collective public awareness of the role people play in the evolution of the COVID-19 pandemic.
Some preliminary findings can be found here: https://lnkd.in/ebr-rab
A perspective paper: Taking the pulse of COVID-19 — A spatiotemporal perspective
Abstract: The sudden outbreak of the Coronavirus disease (COVID-19) swept across the world in early 2020, triggering the lockdowns of several billion people across many countries, including China, Spain, India, the U.K., Italy, France, Germany, and most states of the U.S. The transmission of the virus accelerated rapidly with the most confirmed cases in the U.S., and New York City became an epicenter of the pandemic by the end of March. In response to this national and global emergency, the NSF Spatiotemporal Innovation Center brought together a taskforce of international researchers and assembled implemented strategies to rapidly respond to this crisis, for supporting research, saving lives, and protecting the health of global citizens. This perspective paper presents our collective view on the global health emergency and our effort in collecting, analyzing, and sharing relevant data on global policy and government responses, geospatial indicators of the outbreak and evolving forecasts; in developing research capabilities and mitigation measures with global scientists, promoting collaborative research on outbreak dynamics, and reflecting on the dynamic responses from human societies.

We invite submissions to the special issue “Scaling, Spatio-Temporal Modeling, and Crisis Informatics” by ISPRS International Journal of Geo-Information
Dear Colleagues,
There has been a significant increase in the severity and frequency of crises and hazards worldwide, which are defined as “an interruption in the reproduction of economic, cultural, social and/or political life (Johnston, R.J. (2002). Dictionary of human geography. (4th ed.). Oxford, UK: Blackwell.)”. While extreme weather events are usually the causes of crisis, 2020 has become an expensive and deadly year due to another type of crisis, i.e., the COVID-19 pandemic. Whatever the cause of a crisis, though, technologies like cloud computing, location-based services, network science, web applications, and artificial intelligence (AI) are being used for crisis informatics to aid with crisis management and resilience efforts….
We received funds from the USC COVID-19 Internal Funding Initiative
Dr. Zhenlong Li, teamed with public health colleagues Drs. Xiaoming Li and Bankole Olatosi, receives funds from the USC Office of the Vice President for Research COVID-19 Internal Funding Initiative to conduct preliminary study of a big data approach for better understanding the spatial propagation of the novel coronavirus.

We are developing APPs to visualize population movement through the lens of social media during the COVID-19 Pandemic
Check out our new web app showing near-real time population movement through the lens of social media (twitter) data during the COVID-19 Crisis (more statistical analyses will follow).

Another interactive web app for aggregated population flows and statistics is being developed and tested.

New web portal and human mobility data released: ODT Flow Explorer
Prediction and control of the spread of infectious diseases such as COVID-19 benefits greatly from our growing computing capacity to quantify fine-scale human movement. In response to the soaring needs of human mobility data during the COVID-19 pandemic, we extracted the worldwide daily population flows from billions of geotagged tweets and SafeGraph data, and developed an interactive geospatial web portal, called ODT (Origin-Destination-Time) Flow Explorer, that allows researchers to query, aggregate, visualize, and download daily human movement data at various geographic scales.